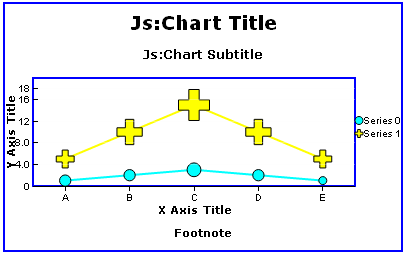
border: {width: 2, color: 'blue'},
chartFrame: {border: {width: 2, color: 'blue'}},
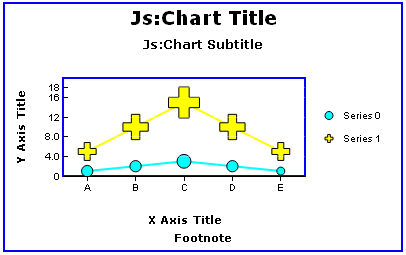
title: {text: 'Js:Chart Title',font: 'bold 14pt Verdana'},
data: [ [[1,2],[2,2],[3,3],[2,2],[1,1]] , [[5,5],[10,10],[15,15],[10,10],[5,5]] ],
chartType: 'line',
subtitle: {visible: true, text: 'Js:Chart Subtitle ',font: 'bold 10pt Verdana'},
footnote: {visible: true, text: 'Footnote',font: 'bold 8pt Verdana'},
labelPadding: {
frame:{left: 0, right: 0, top: 0, bottom: 0},
label:{left: 10, right: 10, top: 10, bottom: 10}
},
yaxis: {max: 18,title: {visible: true,font: 'bold 8pt Verdana'}},
xaxis: {title: {visible: true,font: 'bold 8pt Verdana'}},
legend: {visible: true},
series: [
{series: 'all', color: 'green',marker:{visible: true,shape: 'plus'}},
{series: 0, color: 'cyan', marker: {shape: 'circle'}},{series: 1, color: 'yellow'}
],
blaProperties: {orientation: 'vertical'},
dataLabels: {visible: false}
labelPadding: {
	frame:{left: 10, right: 10, top: 10, bottom: 10},
	label:{left: 0, right: 0, top: 0, bottom: 0}
	},