Chapter 13:
Series/Group Attributes (ASG_)

ATTRIBUTE

Description

ASG_LGND_ITEMS

Legend Items (#of items per row/column in legend area)

ASG_LGND_LAYOUT

Legend Layout (horizontal/vertial)

ASG_REVERSE_GROUPS

Reverse order of data for groups

ASG_REVERSE_SERIES

Reverse order of data for series

ASG_SERIES_COLOR

Series Color

ASG_SERIES_DELETE

Series Delete

ASG_SWAP

Swap series and groups

ASG_LGND_ITEMS


For a horizontal legend area, this attribute sets the number of legend markers per row. For a vertical legend, it sets the number of legend markers per column. Normally, the legend consists of (number of series) markers per row in a horizontal legend, and the (number of series) markers per column in a vertical legend. This attribute allows you to change the number of legend markers per row or column. Zero is the same as using the total number of series to set ASG_LGND_ITEMS.

Type:

INT16

Valid Range:

Zero to number of series in chart.

Default:

Zero

Example:

/* force a horizontal legend
into two rows of markers */
GraphDataInfo graphData;
/* Number of columns in horizontal legend */
INT16 nLegendColumns;
/* Get Number of Series */
GetGraphDataInfo(pGraph, &graphData);
nLegendColumns = (graphData.nRows + 1) / 2;
SetGraphAttrSL(pGraph, NULL,
     ASG_LGND_ITEMS,(void FAR *) &nLegendColumns);


Also See:

ASG_LGND_LAYOUT

Usage

ObjectID

SeriesID

GroupID

GraphTypes

Requirements:

No

No

No

All except 3D Scatter, Spectral, Histogram, and Table

ASG_LGND_LAYOUT


This attribute defines the layout of legend markers/icons and text in the legend box.

Type:

INT16

Valid Range:

One of the following #defines:


#define

Value

Description


LAYOUT_HORIZONTAL

0

Layout the markers horizontally


LAYOUT_VERTICAL

1

Layout the markers vertically


LAYOUT_AUTOMATIC

2

Layout automatically according to the size/location of the legend box (yULC - uLRC > xLRC - yLRC)


LAYOUT_PIE_INFO

3

For single pie charts only. Adds percent and slice values and legend. Always draws vertical legend.


LAYOUT_PIE_INFO_DOLLARS

4

For single pie charts only. Adds percent and slice values only. Always draws vertical legend.


LAYOUT_PIE_INFO_PERCENT

5

For single pie charts only. Adds percent values only. Always draws vertical legend.

Default:

LAYOUT_AUTOMATIC (2)

Example:

BOOLEAN bLayout = LAYOUT_VERTICAL;
SetGraphAttr(gpGraph,GRAPH_LAYER,
     NULL_OBJECTID,NULL_SERIESID,NULL_GROUPID,
     ASG_LGND_LAYOUT,
      (void FAR *) &bLayout);

Notes:

If the legend text and icons are being autofitted (by A2D_AUTOFIT_LEGEND or A2D_AUTOFIT_ALL), this attribute will change the size of legend markers and text to accomodate the size of the legend box. If auto fitting is disabled, the size of the text and markers may need to be adjusted to accomodate the new alignment.

Also See:

ASG_LGND_ITEMS

Usage

ObjectID

SeriesID

GroupID

GraphTypes

Requirements:

No

No

No

All except 3D Scatter, Spectral, Histogram, and Table


ASG_REVERSE_GROUPS


This attribute reverses the order of data read into the groups of a chart. The normal spreadsheet method reads column data into groups and row data into series. This attribute can reverse the order of data assigned to series and groups in the chart.

Type:

BOOLEAN16

Valid Range:

TRUE / FALSE


TRUE=

Reverse groups


FALSE=

Do not reverse groups

Default:

FALSE

Notes:

This attribute is only applicable if ASG_SWAP has been used to exchange the order of series an groups in the graph.

Also See:

ASG_SWAP

Usage

ObjectID

SeriesID

GroupID

GraphTypes

Requirements:

No

No

No

All


ASG_REVERSE_SERIES


This attribute reverses the order of data read into the groups of a chart. The normal spreadsheet method reads column data into groups and row data into series. This attribute can reverse the order of data assigned to series and groups in the chart. This attribute is only applicable if ASG_SWAP has been used to exchange the order of series an groups in the graph.

Type:

BOOLEAN16

Valid Range:

TRUE / FALSE


TRUE=

Reverse series


FALSE=

Do not reverse series

Default:

FALSE

Example:

SetGraphAttr(gpGraph,GRAPH_LAYER,
     NULL_OBJECTID,NULL_SERIESID,NULL_GROUPID,
     ASG_REVERSE_SERIES, (void FAR *) &bTRUE);


SetGraphAttr(gpGraph,GRAPH_LAYER,
     NULL_OBJECTID,NULL_SERIESID,NULL_GROUPID,
     ASG_REVERSE_SERIES, (void FAR *) &bFALSE);


Also See:

ASG_SWAP


ObjectID

SeriesID

GroupID

GraphTypes


No

No

No

All

ASG_SERIES_COLOR


This attribute sets the color of a particular series of risers.

Type:

struct {
     INT16 nSeriesID;
     RGB16 rgb;
} TDG_SeriesColorInfo,FAR *TDG_SeriesColorPtr;

Valid Range:

nSeriesID: An INT16 value identifying the series to be colored


rgb: 0...65535. PGSDK uses a 48-bit color space (16 bits for each element red, green, blue). For the Windows platform, you must multiply each value by 256 to convert a Windows 8-bit color value to the PGSDK 16-bit color value. Example:


nRed = 256; // full red in Windows
MyRGB16 red = nRed<<8; // Set PGSDK to full red

Default:

None

Example:

TDG_SeriesColorInfo Ser1Color;
RGB16 aRGB[5] = {
     { 0, 0, 0},/* BLACK */
     {HALF,HALF,HALF}, /* GREY */
     {FULL, 0, 0}, /* RED */
     { 0,FULL, 0}, /* GREEN */
     { 0, 0,FULL}}; /* BLUE */
Ser1Color.nSeriesID = 1;
/* Color Series 1 Risers Grey */
Ser1Color.rgb = aRGB[1];
SetGraphAttr( gpGraph, GRAPH_LAYER,
     NULL_OBJECTID,
     NULL_SERIESID,
     NULL_GROUPID,
     ASG_SERIES_COLOR,
      (void FAR *) &Ser1Color);

Also See:

ACM_SERIES_COLOR

Usage

ObjectID

SeriesID

GroupID

GraphTypes

Requirements:

No

Yes, specify in nSeriesID

No

All

ASG_SERIES_DELETE


This attribute is the same as API_SLICE_DELETE.

Type:

typedef struct _TDG_SerDepBOOLEAN16 {
     INT16 nSeriesID;     
     BOOLEAN bValue;     
} TDG_SerDepBOOLEAN16, FAR * TDG_SerDepBOOLEAN16Ptr;

Valid Range:

nSeriesID: An INT16 value identifying a valid SeriesID in a graph


bValue: TRUE / FALSE


TRUE=

Delete the series


FALSE=

Do not delete the series

Default:

None

Example:

TDG_SerDepBOOLEAN16 thisSlice;
/* Select Series 1 */
thisSlice.nSeriesID = 1;
/* Delete Series 1 */
thisSlice.bValue = TRUE;
SetGraphAttr(gpGraph,GRAPH_LAYER,
     NULL_OBJECTID,
     NULL_SERIESID,
     NULL_GROUPID,
     ASG_SERIES_DELETE,
      (void FAR *)&thisSlice);

Notes:

1.

This attribute is the same as API_SLICE_DELETE and only works for pie charts. Either attribute will delete the pie slice identified by nSeriesID.


2.

This attribute does not delete the legend text or legend icon associated with the deleted series.

Also See:

API_SLICE_DELETE

Usage

ObjectID

SeriesID

GroupID

GraphTypes

Requirements:

No

Yes, specify in nSeriesID

No

All


ASG_SWAP


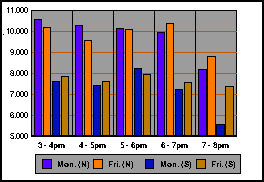
This attribute swaps series and groups. This allows the user to compare data in two ways. When series and groups are swapped, all axis-related objects (labels, grids, risers, etc) are affected. On a bar graph, the series names in the legend will switch with the group names on the ordinal axis. The risers will be reorganized to accommodate the new groups. On a 3D graph, data on the series axis swaps with data on the group axis. See the PGSDK Programmer's Manual for an example of the relationship between series/groups and row/columns and Series/Group vs. Row/Column.

Type:

BOOLEAN16

Valid Range:

TRUE/FALSE


TRUE=

A series is a column in the data matrix. A group is a row in the data matrix.


FALSE=

A series is a row in the data matrix. A group is a column in the data matrix

Default:

FALSE

Example:

GetGraphAttrSL(pGraph,NULL,ASG_SWAP,(void FAR *)&bTRUE);


SetGraphAttrSL(pGraph,NULL,ASG_SWAP,(void FAR *)&bFALSE);


Notes:

This attribute replaces the previously named A2D_AXISSWAP.

Usage

ObjectID

SeriesID

GroupID

GraphTypes

Requirements:

No

No

No

All