Object IDs are named according to the graph types in which they typically appear. Some objects can appear in any graph type and are, therefore, named as common attributes. The first three characters of the object ID identify the graph type in which it typically appears:
![]()
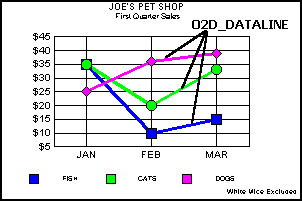
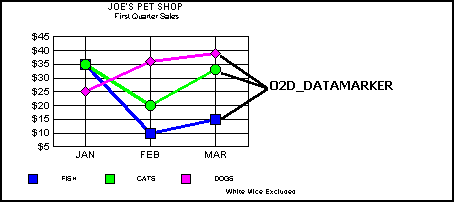
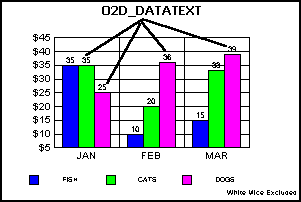
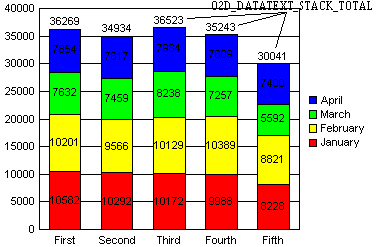
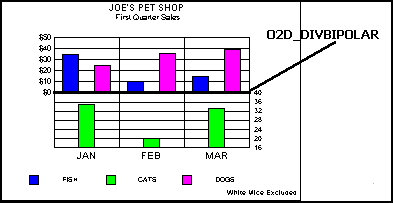
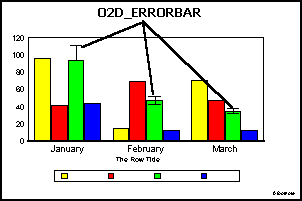
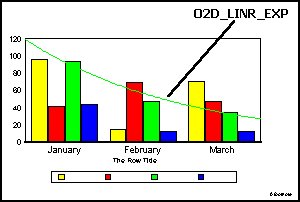
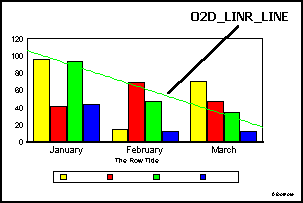
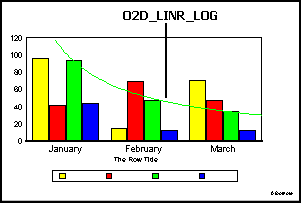
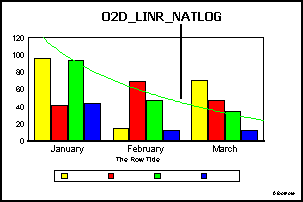
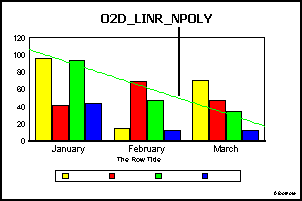
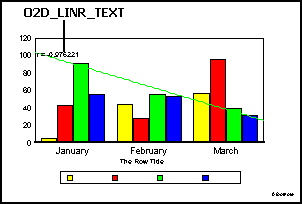
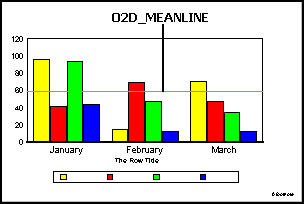
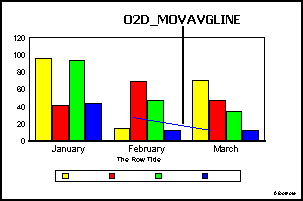
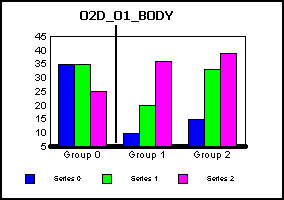
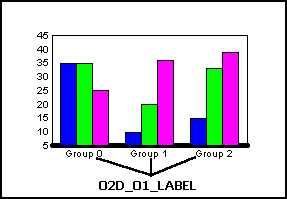
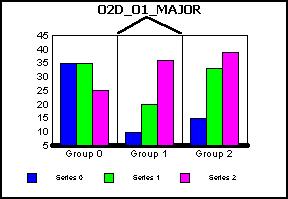
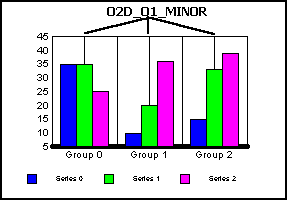
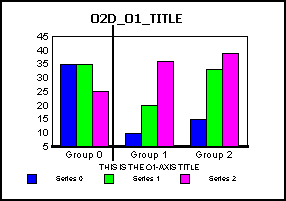
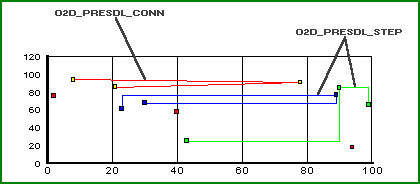
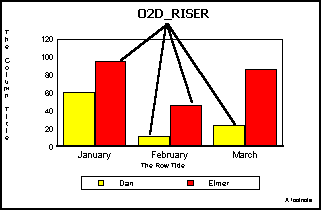
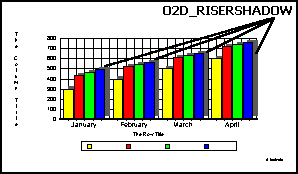
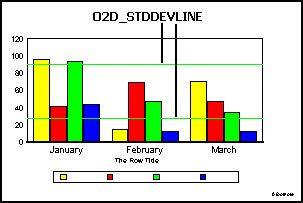
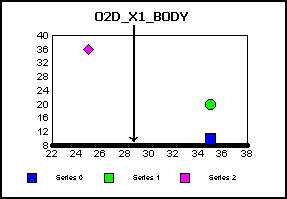
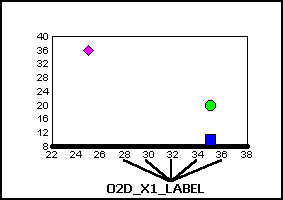
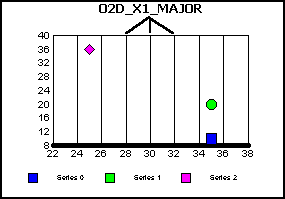
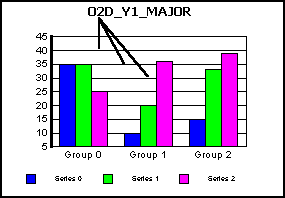
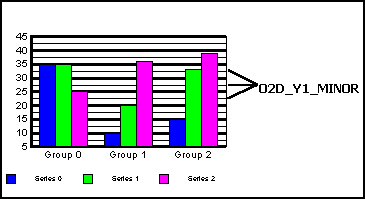
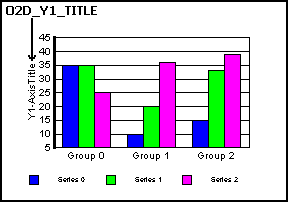
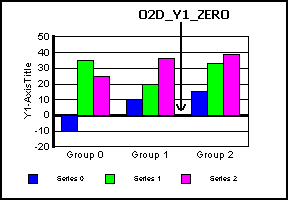
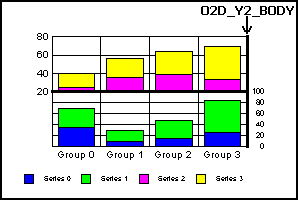
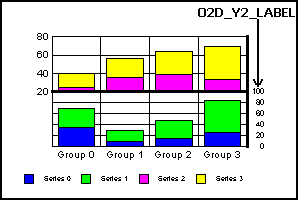
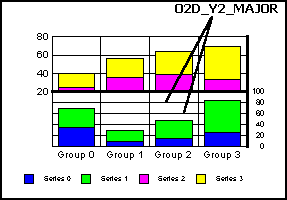
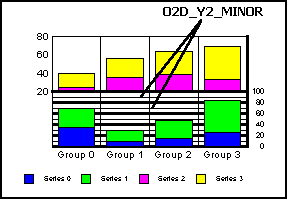
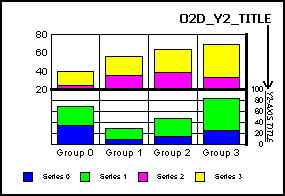
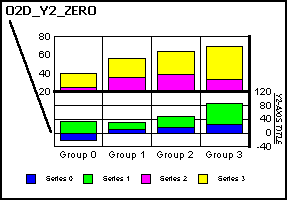
O2D_:
2D graph objects![]()
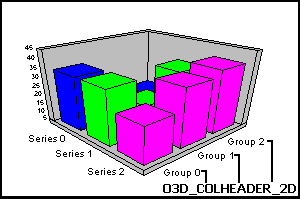
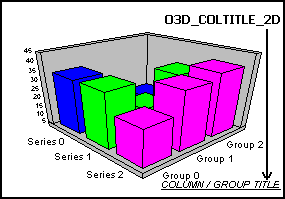
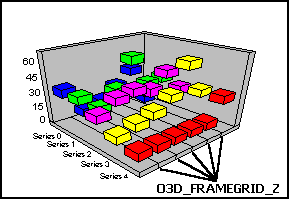
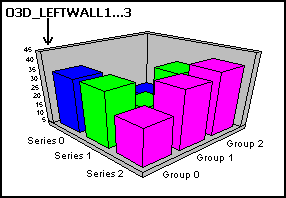
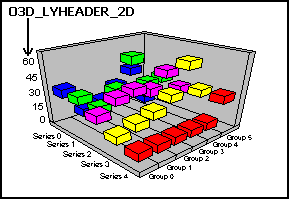
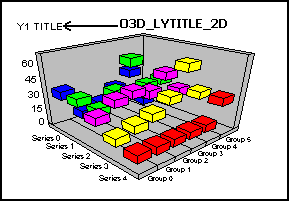
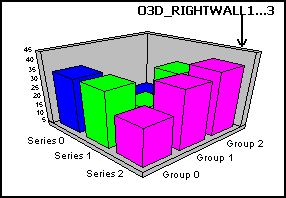
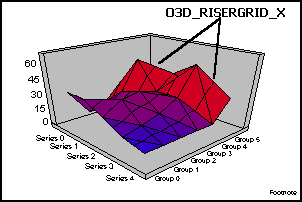
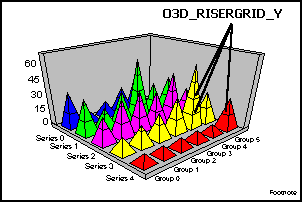
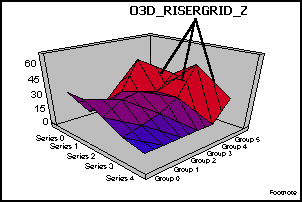
O3D_:
3D graph objects![]()
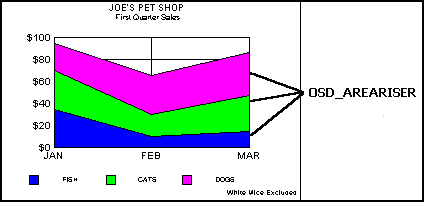
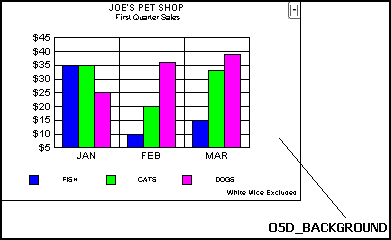
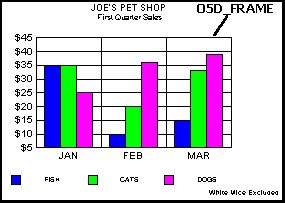
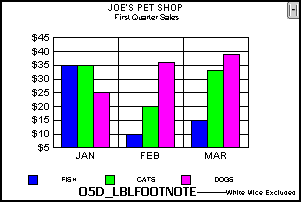
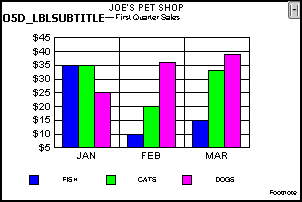
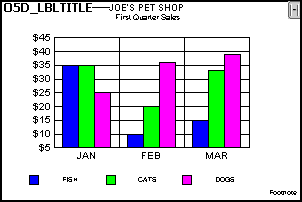
O5D_ :
Common Objects (available to all graph types)![]()
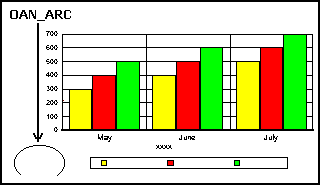
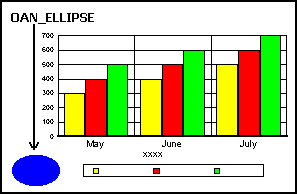
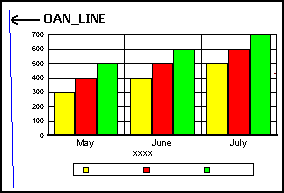
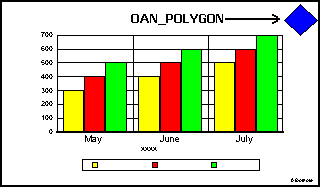
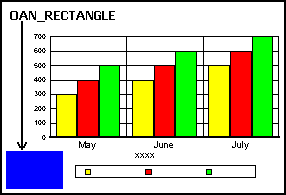
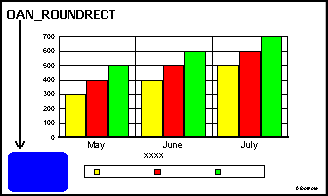
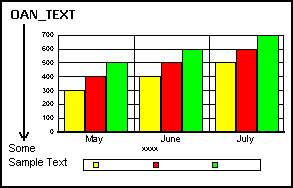
OAN_:
Annotation objects (squares, circles, lines, text, etc)![]()
OBL_:
Bubble Chart objects![]()
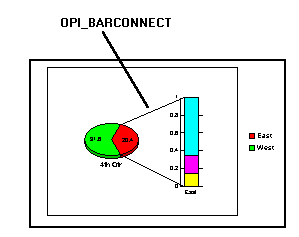
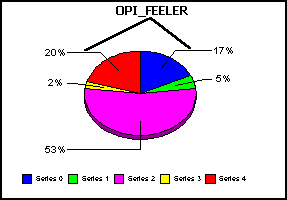
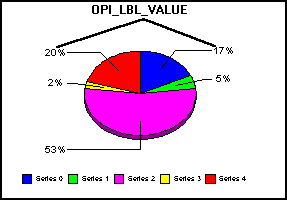
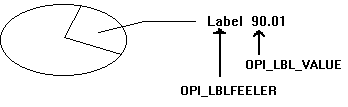
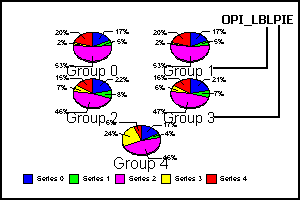
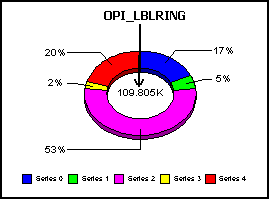
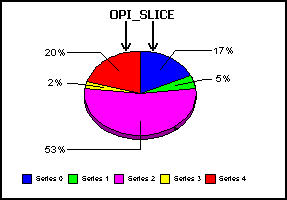
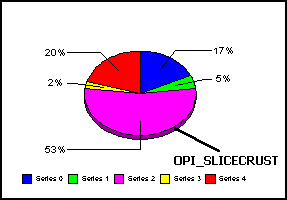
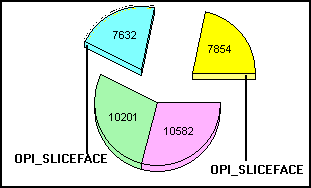
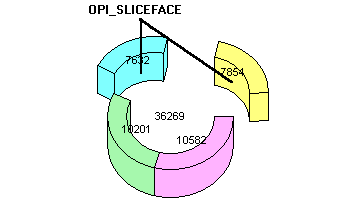
OPI_:
Pie Graph objects![]()
OPL_:
Polar chart objects![]()
OSM_:
Stock Market Chart objects![]()
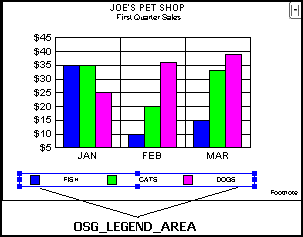
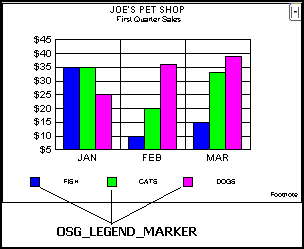
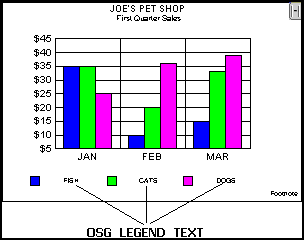
OSG_:
Common Objects (available to all graph types)![]()
OSP_:
Spectral Map objects![]()
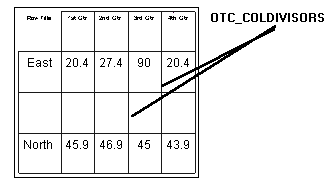
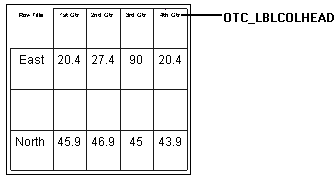
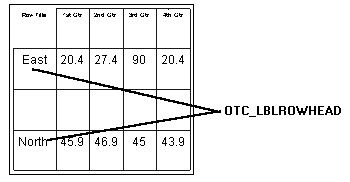
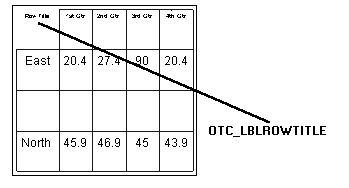
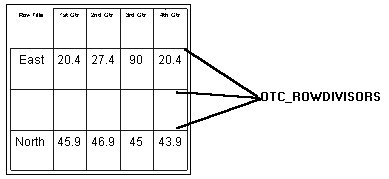
OTC_:
Table chart objects