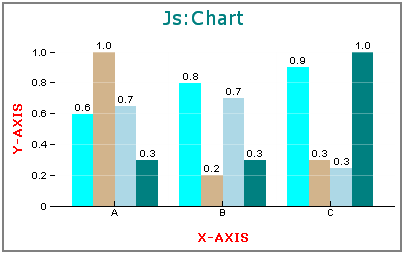
blaProperties: {orientation: 'vertical'},
xaxis: {title: {visible: true, color: 'red', font: 'bold 10pt Verdana',text: 'X-AXIS'}},
yaxis: {title: {visible: true, color: 'red', font: 'bold 10pt Verdana',text: 'Y-AXIS'}},
series: [{series: 0, color: 'cyan'},{series: 1, color: 'tan'},{series: 2, color: 'lightblue'},{series: 3, color: 'teal'}]
chartType: 'heatmap',
yaxis: {colorScale: {colors: ['tan', 'bisque'] } },
xaxis: {title: {visible: true, color: 'red', font: 'bold 10pt Verdana',text: 'X-AXIS'}},
zaxis: {title: {visible: true, color: 'red', font: 'bold 10pt Verdana',text: 'Z-AXIS'}},

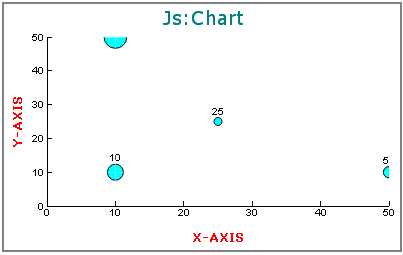
data:  [[[10,10, 100], [25,25, 25], [10,50, 200], [50,10,50]]],
chartType: 'bubble',
xaxis: {title: {visible: true, color: 'red', font: 'bold 10pt Verdana',text: 'X-AXIS'}},
yaxis: {title: {visible: true, color: 'red', font: 'bold 10pt Verdana',text: 'Y-AXIS'}},
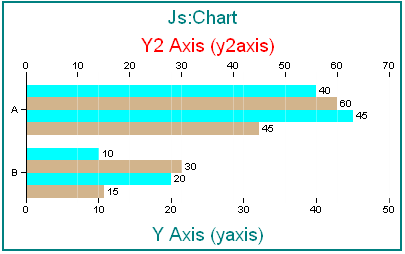
yaxis:{title: {visible: true, text: 'Y Axis (yaxis)',font: '14pt Sans-Serif', color: 'teal'}},
y2axis:{
	title: {
	visible: true,
	text: 'Y2 Axis (y2axis)',
	font: '14pt Sans-Serif', color: 'red'
	}
},
series:[
{series: 0, color: 'cyan', yAxisAssignment: 1},
{series: 1, color: 'tan', yAxisAssignment: 2},
{series: 2, color: 'cyan', yAxisAssignment: 1},
{series: 3, color: 'tan', yAxisAssignment: 2},
]
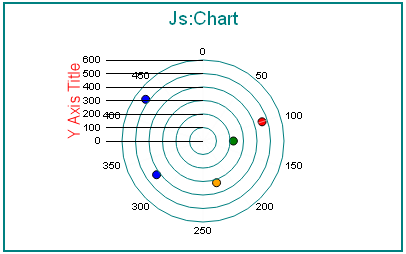
chartType: 'polar',
polarProperties: {
	straightGridLines: false,
	extrudeAxisLabels: true
},
yaxis: {
	title: {visible: true, font: '12pt Sans-Serif', color: 'red'},
	majorGrid: {lineStyle: {width: 1,color: 'teal'}},
},
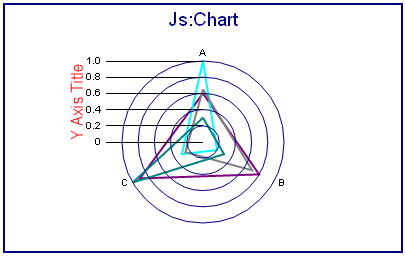
chartType: 'radar',
yaxis: {
	title: {visible: true, font: '12pt Sans-Serif', color: 'red'},
	majorGrid: {lineStyle: {width: 1,color: 'navy'}},
},
polarProperties: {
	extrudeAxisLabels: true
},