These properties control the visibility and format of the group label in a funnel chart.
funnelProperties: {
	groupLabel: {
		visible: false,
		font: '10pt Sans-Serif',
		color: 'black'
	},
},
visible; true/false controls the visibility of the label. The default value is false.
font; a string that defines the size, style, and, typeface of the label. The default value is '10pt Sans-Serif'.
color; a string that defines the color of the label. The default value is 'black'.
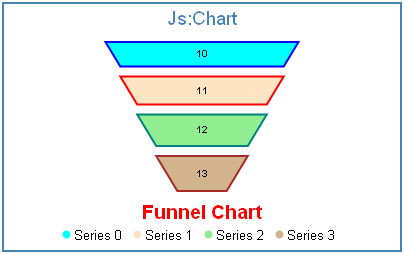
data: [[10,11,12,13]],
chartType: 'funnel',
funnelProperties: {
	topWidth: '50%',
	baseWidth: 1,
	riserGap: 10
	groupLabel: {
		visible: true,
		font: 'bold 14pt Sans-Serif',
		color: 'red'
	}
},
groupLabels: ["Funnel Chart"],
series: [
	{series: 0, color: 'cyan', border: {width: 2, color: 'blue'}},
	{series: 1, color: 'bisque', border: {width: 2, color: 'red'}},
	{series: 2, color: 'lightgreen', border: {width: 2, color: 'teal'}},
	{series: 3, color: 'tan', border: {width: 2, color: 'brown'}},
]
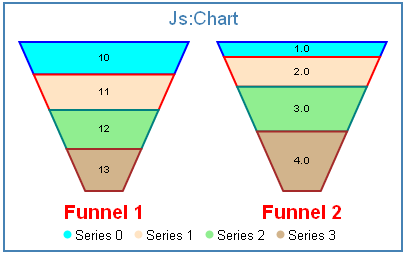
data: [[10,11,12,13],[1,2,3,4]],
chartType: 'funnel',
funnelProperties: {
	groupLabel: {
		visible: true,
		font: 'bold 14pt Sans-Serif',
		color: 'red'
	}
},
groupLabels: ["Funnel 1", "Funnel 2"],
series: [
	{series: 0, color: 'cyan', border: {width: 2, color: 'blue'}},
	{series: 1, color: 'bisque', border: {width: 2, color: 'red'}},
	{series: 2, color: 'lightgreen', border: {width: 2, color: 'teal'}},
	{series: 3, color: 'tan', border: {width: 2, color: 'brown'}},
]