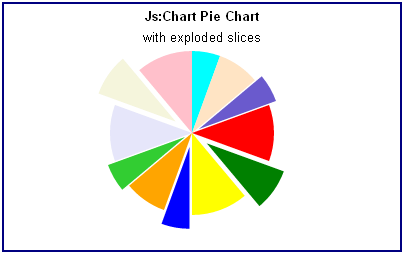
border: {width: 2, color: 'navy'},
chartType: 'pie',
title: {text: 'Js:Chart Pie Chart'},
subtitle: {visible: true, text: 'with exploded slices'},
series: [
	{series: 0, color: 'cyan'},
	{series: 1, color: 'bisque'},
	{series: 2, color: 'slateblue', explodeSlice: 8},
	{series: 3, color: 'red'},
	{series: 4, color: 'green', explodeSlice: 18},
	{series: 5, color: 'yellow'},
	{series: 6, color: 'blue', explodeSlice: 14},
	{series: 7, color: 'orange'},
	{series: 8, color: 'limegreen', explodeSlice: 8},
	{series: 9, color: 'lavender'},
	{series: 10, color: 'beige', explodeSlice: 20},
	{series: 11, color: 'pink'},
]
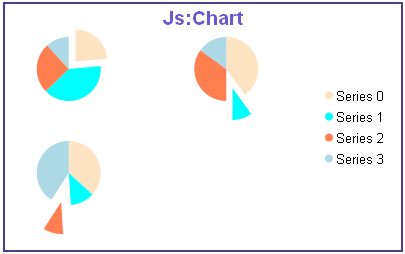
legend: {visible: true},
series: [
	{series: 0, color: 'bisque'},
	{series: 0, group: 0, explodeSlice: 10},
	{series: 1, color: 'cyan'},
	{series: 1, group: 1, explodeSlice: 20},
	{series: 2, color: 'coral'},
	{series: 2, group: 2, explodeSlice: 30},
	{series: 3, color: 'lightblue'},
]