These properties control the content, visibility, and format of the Chart Subtitle
subtitle: {

    text: 'string',

    visible: boolean,

    align: 'string',

    font: 'string',

    color: 'string'

    tooltip: 'string' | function()

}
text; a string that defines the Chart Subtitle text. The default value is 'Chart Subtitle'.
visible; true/false controls the visibility of the Chart Subtitle. The default value is false.
align; a string that defines the alignment of the Chart Subtitle: 'center', 'chartFrame' (center aligned with the chart frame), 'left', or 'right'. The default value is 'center'.
font; a string that defines the size, style, and, typeface of the Chart Subtitle. The default value is '10pt Sans-Serif'.
color; a string that defines the color of the Chart Subtitle. The default value is black.
tooltip: a string or a function that returns a string to show when the mouse hovers over the subtitle. The default value is undefined. A callback function is invoked with three arguments: value, series ID, and group ID. For non-riser objects, set the arguments to undefined. 'this' inside the callback function is set to the parent chart and provides full access to the property tree and API.
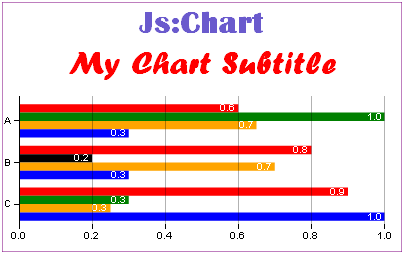
subtitle: {
	text: 'My Chart Subtitle',
	visible: true,
	align: 'center',
	font: 'Bold 24pt Forte',
	color: 'red'
	}
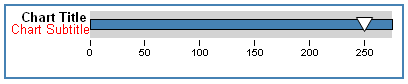
chartType: 'bullet',
title: {text: 'Chart Title'},
subtitle: {visible: true, text: 'Chart Subtitle', color: 'red'},
series: [
{series: 0, group: 0, color: 'steelblue'},
{series: 0, group: 1, color: 'white',marker: {size: 14, shape: 'triangle',border: {width: 1, color: 'black'}}},
]