These properties control the general appearance of a gantt chart.
ganttProperties: {
	startTime: 'string' | undefined,
	stopTime: 'string' | undefined,
	interval: 'string' | undefined,
	labelFormat: 'string' | undefined,
	durationValues: boolean,
	staggerRisers: boolean
},
startTime: a string identifying the start time. It can be almost any kind of string denoting time, mixing hours (xx:xx), days of the week, dates, months and years. Examples: "Mon", "1 July 20", "June 2001", "8:00", "6/10/01", "Thu, 4 Apr 1976 14:30", "2 0:00" (February 1), "1 1 0:00" (January 1). The default value is undefined.
stopTime: a string identifying the start time. As with startTime, the string can be almost any date/time format. The default value is undefined.
interval: a string that specifies the time interval: 'seconds', 'minutes', 'hours', 'days', 'weeks', 'months', 'quarters', or 'years'. This property defines the time gap between each group label. If undefined, the library will assign an interval based on the startTime, stopTime, and the number of groups. The default value is undefined.
labelFormat: a string that defines how a time/date number is converted into a label. If undefined, the library will we use a default formats based on the interval. See http://code.google.com/p/datejs/wiki/FormatSpecifiers for available format options. The default value is undefined.
durationValues: true/false controls the use of the second value in the data set that defines each riser. If false, the second data point is treated as a stop time. If true, the second data point is treated as a duration. The default value is false.
staggerRisers: If false, risers within same group are drawn in one column, stacked above (or beside) each other. In this mode, consecutive risers will be forced to have consecutive start / stop times. If true, risers within same group are drawn beside each other. In this mode, risers can have any arbitrary start / stop times. The default value is true.
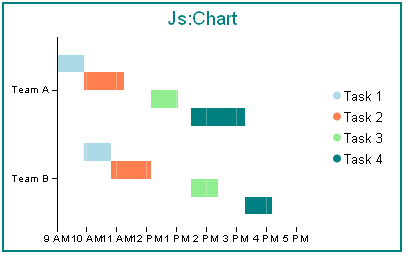
data: [
	[["9A", "10A", 0], ["10A" , "11:30", 1], ["12:30", "1:30P", 2], ["2P", "4P", 3]],
	[["10A", "11A", 0], ["11:00" , "12:30", 1], ["2P", "3P", 2], ["4P", "5P", 3]]
],
chartType: 'gantt',
legend: {visible: true},
ganttProperties: {
	startTime: '9A',
	stopTime: '5P',
	interval: 'hours',
	labelFormat: 'h tt',
	},
groupLabels: ["Team A","Team B"],
series: [
	{series: 0, color: 'lightblue', label: 'Task 1'},
	{series: 1, color: 'coral', label: 'Task 2'},
	{series: 2, color: 'lightgreen', label: 'Task 3'},
	{series: 3, color: 'teal', label: 'Task 4'},
],
- Gantt charts require either two or three values for each riser. The first value is always a start time. The second value is a stop time (if ganttProperties.durationValues: false) or a duration (if ganttProperties.durationValues: true). The optional third value defines the series each riser belongs to.
- To define and format time values on the Y-axis, the first and second values must be formatted as time strings as shown in this example.