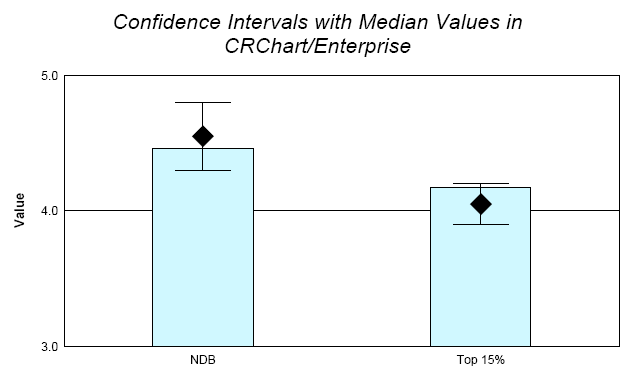
This macro draws error bars with a median band. The data set that draws the chart must be in the following form:
Value 1: Series Value
Value 2: Error High Value
Value 3: Error Low ValueSYNTAX:
@EB3 bShowErrorBars nHatPercent nMarkerPercent nMarkerShapePARAMETERS:
bShowErrorBars; 0 = Do not draw error bars, 1 = Draw error bars
nHatPercent; 0...100 width of hat on error bar
nMarkerPercent; 0...100 size of marker above error bar
nMarkerShape; 0...60 selects a marker shape (See @MARKER for possible values)EXAMPLE:
@EB3 1 50 50 5
PERSISTENT:
NO
REQUIREMENTS:
- Crystal Reports 11 or higher
Next Macro
![]() Previous Macro
Previous Macro![]() Return to Alpha List
Return to Alpha List
Next Macro in this Group
![]() Previous Macro in this Group
Previous Macro in this Group![]() Return to Group List
Return to Group List