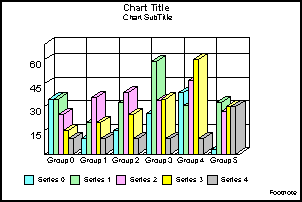

In 3D charts and charts where 2.5D depth is applied with DepthRadius, this property enables/disables automatic shading of risers in the chart. If a 3D graph type is selected, it also enables and disables shading of the 3D cube. If this property is true, light source settings are used to automatically shade the faces of a 3D chart, simulating a cast light beam. If this property is false, all sides of 3D risers or the 3D cube is the same color. It is not possible to color each face separately.
DATA TYPE:
boolean
RANGE:
true / false; true = Enable autoshading, false = Disable autoshading
DEFAULT:
true
SYNTAX:
EXAMPLE:
NOTE:
- When a 3D chart is used and Autoshading is disabled (false), the CubeLightSourceX, CubeLightSourceY, and CubeLightSourceZ properties are also disabled.
- This property has not affect on 3D smooth GraphTypes: 15 (3D Smooth Surface), 16 (3D Smooth Surface with Sides), 116 (3D Smooth Connected Groups), and 117 (3D Smooth Connected Series).
- The AutoshadingWalls property can be used to enable/disable shading of the 3D cube walls independent of risers.
ALSO SEE:
AutoshadingWalls, CubeLightSourceX, CubeLightSourceY, CubeLightSourceZ
This property sets the color mode to be used in the chart (automatic, color-by-series, or color-by-group). For 3D Surface charts, automatic mode (0) will cause the chart to be colored by height. For Bar, Line, and Area charts, automatic mode (0) will color the chart by series if there is more than one series or by groups if there is only one series.
DATA TYPE:
integer
RANGE:
0...2; 0 = Automatic. Use the group as the series if there is only one series. 3D Connected Series Ribbon and Areas are colored by series. 3D Group Ribbon and Areas are colored by group. 1 = Color by Series. 2 = Color by Group
DEFAULT:
0 (Automatic)
SYNTAX:
EXAMPLE:
NOTE:
When color by group (setColorMode(2); ) is selected, the legend is always automatically turned off.
ALSO SEE:
ExactColorByHeight, getColorByHeight(), getEffectiveColorMode()
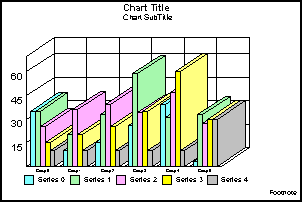
This property and DepthRadius can be used to apply a 2.5D depth effect to bar, line, area, scatter, and bubble charts. This property sets the angle from the front of the chart frame to the back (in degrees) at which the chart risers and frame are drawn.
DATA TYPE:
integer
RANGE:
0...180 degrees
DEFAULT:
45 degrees
SYNTAX:
EXAMPLE:
setDepthAngle(20);
NOTE:
- The DepthRadius property must be greater than zero in order for this property to be properly applied to the graph.
- This property is ignored if the chart uses a time scale axis.
ALSO SEE:
When charts are drawn with a 2.5D effect (DepthAngle > 0), this property sets how far out the extruded frame will be extended. Small values produce a very narrow chart, larger values produce a thicker chart.
DATA TYPE:
integer
RANGE:
0...100
DEFAULT:
40
SYNTAX:
EXAMPLE:
setDepthRadius(20);
NOTE:
- If this property is set to zero, the DepthAngle property will be ignored.
- This property is ignored if the chart uses a time scale axis.
ALSO SEE:
This property enables (true) / disables (false) exact coloring by height in spectral maps and 3D surface charts. When this property is enabled (true), the actual data value is used to get a color from the "color-by-height gradient". When this property is disabled (false), the colors on the spectral legend are the only ones used and the data value is compared to see which of those "buckets" it falls into.
DATA TYPE:
boolean
RANGE:
true/false; true = Enable exact color by height, false = Disable exact color by height
DEFAULT:
true
SYNTAX:
EXAMPLE:
setExactColorByHeight(false);
setGradientPinLeftColor(getColorByHeight(),new Color (106,189,187),0);
setGradientPinLeftColor(getColorByHeight(),new Color(0,255,255),1);
setGradientPinRightColor(getColorByHeight(),new Color(0,255,255),1);
setGradientPinRightColor(getColorByHeight(),new Color(106,189,187),0);
setGraphType(87);
ALSO SEE:
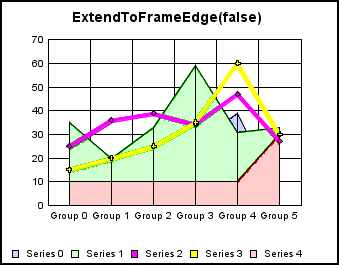
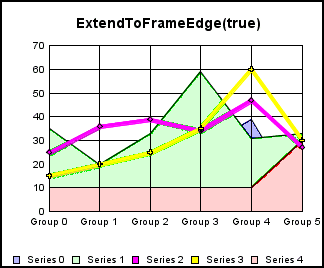
In area charts, line charts, and combination charts that do not include bars, this property enables/disables extension of the risers to the chart frame edge.
DATA TYPE:
boolean
RANGE:
true/false; true = Extend risers to frame edge, false = Do not extend risers to frame edge
DEFAULT:
true
SYNTAX:
EXAMPLE:
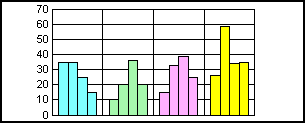
setDepthRadius(0);
setDepthAngle(0);
setSubtitleDisplay(false);
setFootnoteDisplay(false);
setTitleString("ExtendToFrameEdge(false)");
setSeriesType(getSeries(2),2);
setSeriesType(getSeries(3),2);
setSeriesType(getSeries(0),3);
setSeriesType(getSeries(4),3);
setSeriesType(getSeries(1),3);
setExtendToFrameEdge(false);
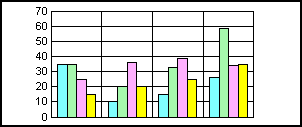
setDepthRadius(0);
setDepthAngle(0);
setSubtitleDisplay(false);
setFootnoteDisplay(false);
setTitleString("ExtendToFrameEdge(true)");
setSeriesType(getSeries(2),2);
setSeriesType(getSeries(3),2);
setSeriesType(getSeries(0),3);
setSeriesType(getSeries(4),3);
setSeriesType(getSeries(1),3);
setExtendToFrameEdge(true);
This property enables (true) / disables (false) drawing of the chart frame.
DATA TYPE:
boolean
RANGE:
true / false; true = Draw chart frame, false = Do not draw chart frame
DEFAULT:
true
SYNTAX:
EXAMPLE:
setY1MajorGridDisplay(false);
setY1AxisLineDisplay(false);
setO1AxisLineDisplay(false);
setO1MajorGridDisplay(false);
setDepthRadius(0);
setFrameDisplay(false);
setFrameDisplay(true);
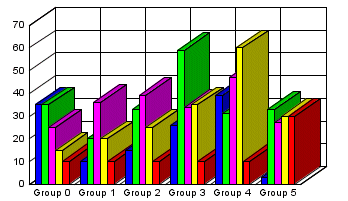
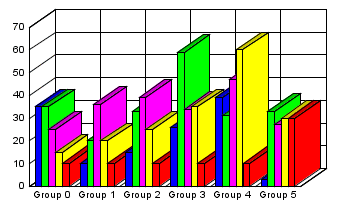
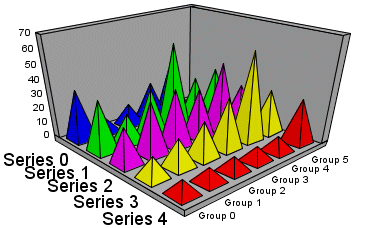
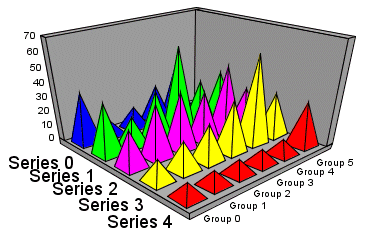
This property selects a graph type. Perspective for Java includes a wide variety of two- and three-dimensional graphs. Major graph types include: Area, Bar, Bubble, Funnel, Gauge, Gantt, Histogram, Line, Pareto, Pie, Radar, Scatter, Spectral Map, Stock, and Waterfall.
DATA TYPE:
integer
RANGE:
0...117
GraphType Value
GraphType
0
3D Bars
1
3D Pyramids
2
3D Octagons
3
3D Cylinder
4
3D Floating Cubes
5
3D Floating Pyramids
6
3D Connected Series Area
7
3D Connected Series Ribbon
8
3D Cone
9
3D Connected Group Area
10
3D Connected Group Ribbon
11
3D Sphere
12
3D Surface
13
3D Surface with Sides
14
3D Honeycomb Surface
15
3D Smooth Surface
16
3D Smooth Surface with Sides
17
Vertical Clustered Bars
18
Vertical Stacked Bars
19
Vertical Dual-Axis Clustered Bars
20
Vertical Dual-Axis Stacked Bars
21
Vertical Bi-Polar Clustered Bars
22
Vertical Bi-Polar Stacked Bars
23
Vertical Percent Bars
24
Horizontal Clustered Bars
25
Horizontal Stacked Bars
26
Horizontal Dual-Axis Clustered Bars
27
Horizontal Dual-Axis Stacked Bars
28
Horizontal Bi-Polar Clustered Bars
29
Horizontal Bi-Polar Stacked Bars
30
Horizontal Percent Bars
31
Vertical Absolute Area
32
Vertical Stacked Area
33
Vertical Bi-Polar Absolute Area
34
Vertical Bi-Polar Stacked Area
35
Vertical Percent Area
36
Horizontal Absolute Area
37
Horizontal Stacked Area
38
Horizontal Bi-Polar Absolute Area
39
Horizontal Bi-Polar Stacked Area
40
Horizontal Percent Area
41
Vertical Absolute Line
42
Vertical Stacked Line
43
Vertical Dual-Axis Absolute Line
44
Vertical Dual-Axis Stacked Line
45
Vertical Bi-Polar Absolute Line
46
Vertical Bi-Polar Stacked Line
47
Vertical Percent Line
48
Horizontal Absolute Line
49
Horizontal Stacked Line
50
Horizontal Dual-Axis Absolute Line
51
Horizontal Dual-Axis Stacked Line
52
Horizontal Bi-Polar Absolute Line
53
Horizontal Bi-Polar Stacked Line
54
Horizontal Percent Line
55
Pie
56
Ring Pie
57
Multi Pie
58
Multi Ring Pie
59
Multi Proportional Pie
60
Multi Proportional Ring Pie
61
XY Scatter
62
XY Scatter Dual-Axis
63
XY Scatter with Labels
64
XY Scatter with Labels Dual-Axis
65
Polar
66
Polar Dual-Axis
67
Radar Line
68
Radar Area
69
Radar Line Dual-Axis
70
Open-Hi-Lo-Close Candle Stock Chart
71
Open-Hi-Lo-Close Candle Stock Chart with Volume
72
Candle Stock Hi-Lo Open-Close
73
Stock Hi-Lo
74
Stock Hi-Lo Dual-Axis
75
Stock Hi-Lo Bi-Polar
76
Stock Hi-Lo Close
77
Stock Hi-Lo Close Dual-Axis
78
Stock Hi-Lo Bi-Polar
79
Stock Hi-Lo Open-Close
80
Stock Hi-Lo Open-Close Dual-Axis
81
Stock Hi-Lo Open-Close Bi-Polar
82
Stock Hi-Lo with Volume
83
Stock Hi-Lo Open-Close with Volume
84
Candle Stock Hi-Lo Open-Close with Volume
85
Vertical Histogram
86
Horizontal Histogram
87
Spectral Map
88
Stock Hi-Lo Close with Volume
89
Bubble Chart
90
Bubble Chart with Labels
91
Bubble Chart Dual-Axes
92
Bubble Chart with Labels Dual-Axes
93
Pie-Bar Chart
94
Ring Pie-Bar Chart
99
Gantt Chart
100
Vertical Waterfall Chart
101
Horizontal Waterfall Chart
102
Pareto Chart
103
Multi-Y Y1/Y2/Y3-Axes Chart
104
Multi-Y Y1/Y2/Y3/Y4-Axes Chart
105
Multi-Y Y1/Y2/Y3/Y4/Y5-Axes Chart
106
Funnel Chart
110
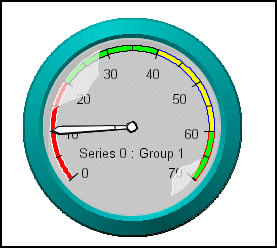
Gauge Chart
116
3D Smooth Connected Groups
117
3D Smooth Connected Series
DEFAULT:
17 (Vertical Bar, Side-by-Side)
SYNTAX:
EXAMPLE:
setGraphType(0);
setGraphType(110);