
When manual O1-axis label skipping is defined with O1LabelAutoSkip, O1LabelSkipBegin, and O1LabelSkipCount, this property enables/disables the O1-Axis grid lines (if present) to follow label skipping. If enabled (true), grid lines are not skipped with the label skip mode. If disabled (false), O1-axis grid lines follow label skipping set by O1LabelAutoSkip, O1LabelSkipBegin, and O1LabelSkipCount.
DATA TYPE:
boolean
RANGE:
true/false; true = Do not adjust O1-axis grid lines to follow lable skipping, false = Adjust O1-axis grid lines to follow label skipping
DEFAULT:
false
SYNTAX:
ALSO SEE:
When O1-axis label skipping is defined with O1LabelAutoSkip, O1LabelSkipBegin, and O1LabelSkipCount, this property enables/disables the O1-Axis tick marks (if present) to follow label skipping. If enabled (true), tick marks are not skipped with the label skip mode. If disabled (false), tick marks follow label skipping set by O1LabelAutoSkip, O1LabelSkipBegin, and O1LabelSkipCount.
DATA TYPE:
boolean
RANGE:
true/false; true = Do not adjust O1-axis tick marks to follow lable skipping, false = Adjust O1-axis tick marks to follow label skipping
DEFAULT:
false
SYNTAX:
This property enables/disables drawing of the O1 axis line. O1AxisSide defines the location of the O1-axis line. The O1 axis line is typically displayed on the bottom of a vertical chart or on the left side of a horizontal chart. Because the O1-axis base line is typically at the base or side of the chart frame, the line may not be visible even when this property is enabled. The setLineWidth() method can be used to make the O1-axis line wider and, therefore, more visible.
DATA TYPE:
boolean
RANGE:
true / false; true = Draw O1-axis base line, false = Do not draw O1-axis line
DEFAULT:
true
SYNTAX:
EXAMPLE:
setDepthRadius(0);
setY1MajorGridDisplay(false);
setY1AxisLineDisplay(false);
setO1MajorGridDisplay(false);
setFrameDisplay(false);
setO1AxisLineDisplay(true);
setO1AxisLineDisplay(false);
ALSO SEE:
O1AxisSide, O1/O2LabelDisplay, setAxisSide(), setLineWidth()
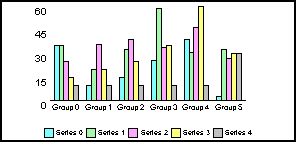
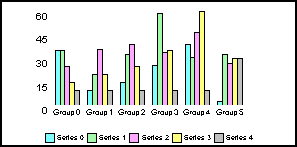
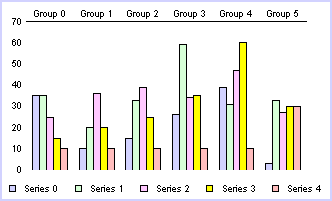
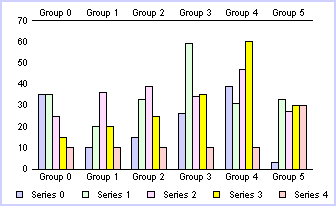
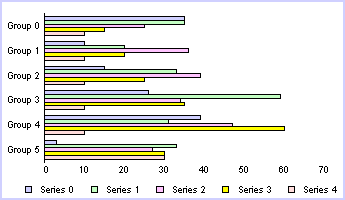
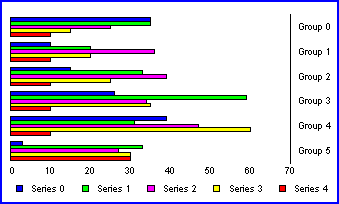
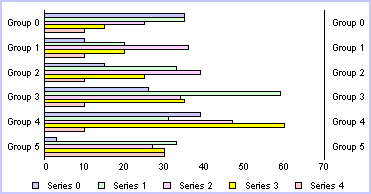
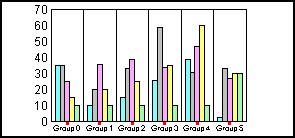
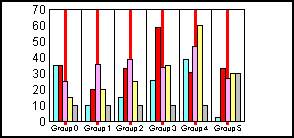
This property controls which side of the graph the primary ordinal (O1) axis will be imaged. It also determines where axis labels will be drawn when O1LabelDisplay is true. The primary ordinal axis is typically imaged at the bottom of a vertical chart or left side of a horizontal chart.
DATA TYPE:
integer
RANGE:
0...2; 0 = Vertical: Bottom / Horizontal: Left, 1 = Vertical: Top / Horizontal: Right, 2 = Vertical: Top and Bottom / Horizontal: Right and Left
DEFAULT:
0 (bottom/left)
SYNTAX:
EXAMPLE:
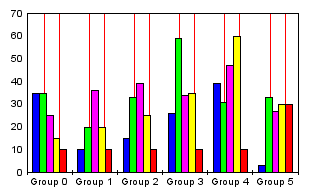
setDepthRadius(0);
setY1MajorGridDisplay(false);
setY1AxisLineDisplay(false);
setO1MajorGridDisplay(false);
setFrameDisplay(false);
setO1AxisSide(1);
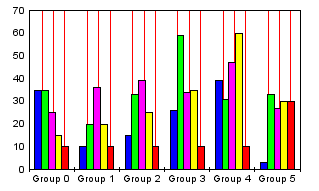
setO1AxisSide(2);
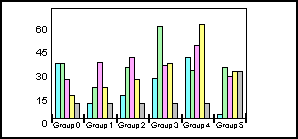
setDepthRadius(0);
setGraphType(24);
setY1MajorGridDisplay(false);
setY1AxisLineDisplay(false);
setO1MajorGridDisplay(false);
setFrameDisplay(false);
setO1AxisSide(0);
setO1AxisSide(1);
setO1AxisSide(2);
ALSO SEE:
The O1ExcludeMaxLabel property controls drawing of the maximum label on the primary ordinal (O1) axis. The O2ExcludeMaxLabel property enables (true) / disables (false) drawing of the maximum label on the series (O2) axis.
DATA TYPE:
boolean
RANGE:
true / false; true = Exclude the maximum label, false = Include the maximum label
DEFAULT:
false
SYNTAX:
EXAMPLE:
setDepthRadius(0);
setY1MajorGridDisplay(false);
setY1AxisLineDisplay(false);
setO1MajorGridDisplay(false);
setO1ExcludeMaxLabel(true);
setO2ExcludeMaxLabel(true);
setGraphType(0);
setAutoshading(false);
ALSO SEE:
This O1ExcludeMinLabel property controls drawing of the minimum label on the primary ordinal (O1) axis. The O2ExcludeMinLabel property controls drawing of the minimum label on the series (O2) axis.
DATA TYPE:
boolean
RANGE:
true / false; true = Exclude the minimum label, false = Include the minimum label
DEFAULT:
false
SYNTAX:
EXAMPLE:
setDepthRadius(0);
setY1MajorGridDisplay(false);
setY1AxisLineDisplay(false);
setO1MajorGridDisplay(false);
setO1ExcludeMinLabel(true);
EXAMPLE:
setO2ExcludeMinLabel(true);
setGraphType(0);
setAutoshading(false);
ALSO SEE:
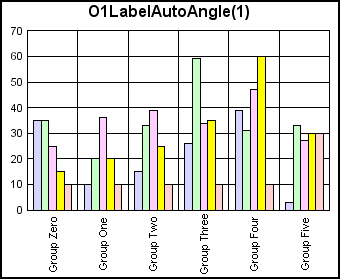
When O1-Axis/Group labels are long and/or set to a large font size such that they overlap, this property allows labels to be drawn at an angle.
DATA TYPE:
integer
RANGE:
0...2; 0 = No Rotation, 1 = 90 Degrees Rotation, 2 = 270 Degrees Rotation
DEFAULT:
0 (No Rotation)
SYNTAX:
EXAMPLE:
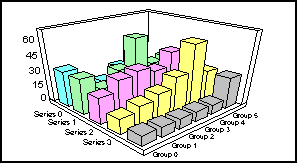
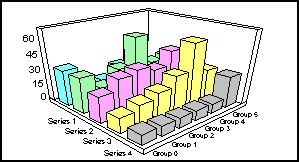
setDepthRadius(0);
setDepthAngle(0);
setFootnoteDisplay(false);
setSubtitleDisplay(false);
setLegendDisplay(false);
setGroupLabel(0, "Group Zero");
setGroupLabel(1, "Group One");
setGroupLabel(2, "Group Two");
setGroupLabel(3, "Group Three");
setGroupLabel(4, "Group Four");
setGroupLabel(5, "Group Five");
setO1LabelAutoAngle(1);
setTitleString("O1AutoAngle(1)");
ALSO SEE:
These properties control automatic fitting/sizing of all text labels on the O1/group-axis and O2/series-axis. When auto-fitting is enabled (the default), the font size of these objects cannot be changed to a size that is larger than the relative location/size of the object and objects around it. TextAutofitMax and TextAutofitMin define the maximum and minimum size (in virtual coordinates) that can be used to auto-fit/size when this property is enabled. When auto-fitting is disabled, the font size can be set to any value allowing very large font sizes to overlap other objects.
DATA TYPE:
boolean
RANGE:
true = Automatically fit and size labels, false = Do not automatically fit/size labels
DEFAULT:
true
SYNTAX:
EXAMPLE:
setDepthRadius(0);
setFontSize(getO1Label(),6);
setO1LabelAutofit(false);
setGraphType(0);
setO2LabelAutofit(true);
NOTE:
Labels can overlap when the font size is too large and autofitting is disabled. If you want to use a larger font size, use O1/O2LabelRotate, O1LabelStagger, or O1/O2LabelWrap to change the labels so that they don't overlap.
ALSO SEE:
O1/O2LabelDisplay, O1/O2LabelRotate, O1LabelStagger, O1/O2LabelWrap
These properties control label skipping on the O1/group-axis and O2/series-axis. If this property is set to manual skip (2), O1/O2LabelSkipBegin defines the first label to skip and O1/2LabelSkipCount defines the skip interval. If this property is set to automatic (1), Perspective will automatically omit labels at regular intervals when the chart size is reduced in order to maintain a reasonable, readable font size (8 point or larger).
DATA TYPE:
integer
RANGE:
0...2; 0 = No skipping, 1 = Automatic Skip, 2 = Manual Skip
DEFAULT:
Zero (No Skipping)
SYNTAX:
EXAMPLE:
setTitleDisplay(false);
setSubtitleDisplay(false);
setFootnoteDisplay(false);
setGraphType(0);
setO2LabelSkipBegin(1);
setO2LabelSkipCount(1);
setO2LabelAutoSkip(2);
ALSO SEE:
This property controls the visibility of labels and titles on the O1/group-axis and O2/series-axis. O1AxisSide can be used to define the location of O1-axis labels.
DATA TYPE:
boolean
RANGE:
true / false; true = Draw labels, false = Do not draw labels
DEFAULT:
true
SYNTAX:
EXAMPLE:
setY1MajorGridDisplay(false);
setY1AxisLineDisplay(false);
setO1MajorGridDisplay(false);
setDepthRadius(0);
setO1LabelDisplay(false);
setGraphType(0);
setO2LabelDisplay(false);
ALSO SEE:
O1/O2LabelAutofit, O1AxisSide, O1/O2LabelRotate, O1LabelStagger, O1/O2LabelWrap
This property selects the percentage (0...100) of the label width that will be used as margin between labels on the O1-axis.
DATA TYPE:
integer
RANGE:
0...100
DEFAULT:
Zero
SYNTAX:
EXAMPLE:
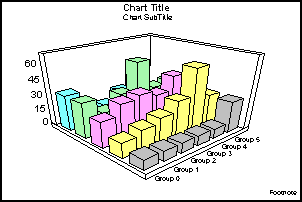
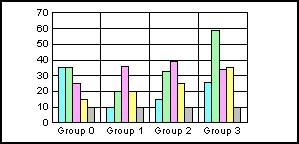
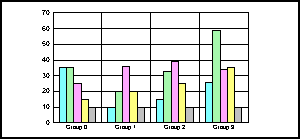
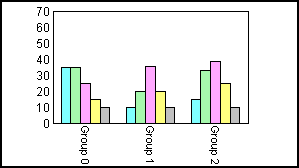
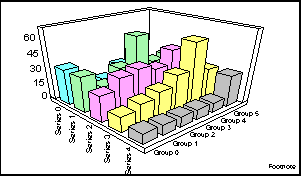
setDepthRadius(0);
setViewableGroups(4);
setViewableSeries(5);
setDataScrollerPresenceGroups(0);
setO1LabelMargin(10);
setO1LabelMargin(50);
This property selects an angle at which labels will be rotated on the primary ordinal (O1) and O2/series-axes.
DATA TYPE:
integer
RANGE:
0...2; 0 = No text rotation, 1 = Rotate text 90 degrees (reads top to bottom), 2 = Rotate text 270 degrees (reads bottom to top), 3 = Rotate text 45 degrees
DEFAULT:
Zero
SYNTAX:
EXAMPLE:
setViewableGroups(3);
setDataScrollerPresenceGroups(0);
setY1MajorGridDisplay(false);
setY1AxisLineDisplay(false);
setO1MajorGridDisplay(false);
setDepthRadius(0);
setLegendDisplay(false);
setO1LabelRotate(2);
setGraphType(0);
setO2LabelRotate(1);
ALSO SEE:
O1AxisSide, O1/O2LabelAutofit, O1/O2LabelDisplay, O1LabelStagger, O1/O2LabelWrap
When O1/O2LabelAutoSkip is two (manual), these properties define the first label on the O1-axis or O2-axis to be omitted. O1/O2LabelSkipCount defines the label skip interval.
DATA TYPE:
integer
RANGE:
Zero to number of groups in graph
DEFAULT:
Zero
SYNTAX:
EXAMPLE:
setO1LabelSkipCount(1);
setO1LabelAutoSkip(2);
setY1AxisLineDisplay(false);
setO1MajorGridDisplay(false);
setDepthRadius(0);
setO1LabelSkipBegin(1);
setO1LabelSkipCount(1);
setO1LabelSkipBegin(0);
ALSO SEE:
When O1/O2LabelAutoSkip is manual (2), these properties define the label skip interval. O1/O2LabelSkipBegin defines the first label to be omitted.
DATA TYPE:
integer
RANGE:
Zero to number of groups in graph
DEFAULT:
Zero
SYNTAX:
EXAMPLE:
setO1LabelSkipBegin(1);
setO1LabelAutoSkip(2);
setY1MajorGridDisplay(false);
setY1AxisLineDisplay(false);
setO1MajorGridDisplay(false);
setDepthRadius(0);
setO1LabelSkipCount(1);
ALSO SEE:
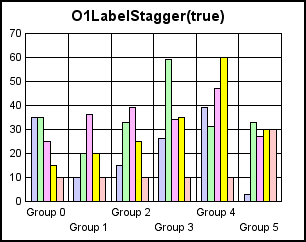
This property enables/disables staggered labels on the O1-axis.
DATA TYPE:
boolean
RANGE:
true / false; true = Stagger labels on the O1-axis, false = Do not stagger labels
DEFAULT:
false
SYNTAX:
EXAMPLE:
setDepthRadius(0);
setDepthAngle(0);
setFootnoteDisplay(false);
setSubtitleDisplay(false);
setLegendDisplay(false);
setO1LabelStagger(true);
setTitleString("O1LabelStagger(true)");
NOTE:
This property only applies to 2D graphs, staggered labels are not supported in 3D graphs.
ALSO SEE:
O1AxisSide, O1/O2LabelAutofit, O1/O2LabelDisplay, O1LabelRotate, O1/O2LabelWrap, get/setLabelStagger()
These properties control label wrapping on the O1-axis and O2-axis. When label wrapping is enabled, the charting engine will look for space characters in the label string and draw the label on multiple lines at space character boundaries. When label wrapping is disabled, the label string will always be drawn on a single line.
DATA TYPE:
boolean
RANGE:
true / false; true = Wrap labels, false = Draw labels on a single line
DEFAULT:
false
SYNTAX:
EXAMPLE:
setDepthRadius(0);
setY1MajorGridDisplay(false);
setY1AxisLineDisplay(false);
setO1MajorGridDisplay(false);
setO1LabelWrap(true);
setO2LabelAutofit(false);
setFontSizeVC(getO2Label(),2086);
setGraphType(0);
setO2LabelWrap(true);
NOTE:
If a "\n" is encountered in the label string, the string will be wrapped even if this property is disabled (setO1LabelWrap(false); ).
ALSO SEE:
O1AxisSide, O1/O2LabelAutofit, O1/O2LabelDisplay, O1/O2LabelRotate, O1LabelStagger
This property controls drawing of major grid lines on the O1-axis (i.e., lines attached to a text-based axis, "bottom" axis of a bar chart). O1AxisSide defines the location where grids/ticks are displayed. O1MajorGridStyle defines the style of major grid lines. The primary ordinal axis can have major and minor grid lines. In the default configuration, major grid lines are drawn and minor grid lines are not.
DATA TYPE:
boolean
RANGE:
true / false; true = Draw major grid lines on the O1-axis, false = Do not draw
DEFAULT:
true
SYNTAX:
EXAMPLE:
setDepthRadius(0);
setY1MajorGridDisplay(false);
setY1AxisLineDisplay(false);
setO1MajorGridDisplay(true);
setO1MajorGridDisplay(false);
ALSO SEE:
O1AxisSide, O1MajorGridStyle, O1MinorGridDisplay, O1MinorGridStyle
This property controls the style of major grid lines on the O1-axis (i.e., lines attached to a text-based axis, "bottom" axis of a bar graph). The primary ordinal axis can have major and minor grid lines. Different styles should be selected for major and minor grid lines so the user can distinguish between the two.
DATA TYPE:
integer
RANGE:
0...4; 0 = Normal grid lines, height of frame, 1 = Normal grid lines extend beyond the height of frame, 2 = Small tick marks from frame edge inward, 3 = Small tick marks from frame edge outward, 4 = Small tick marks span across the frame edge
DEFAULT:
Zero (Normal grid lines)
SYNTAX:
EXAMPLE:
setDepthRadius(0);
setY1MajorGridDisplay(false);
setY1AxisLineDisplay(false);
setLineWidth(getO1MajorGrid(),4);
setO1MajorGridStyle(3);
setO1MajorGridStyle(4);
ALSO SEE:
O1AxisSide, O1MajorGridDisplay, O1MinorGridDisplay, O1MinorGridStyle, get/setGridStyle()
This property enables (true) / disables (false) drawing of major tick marks on the primary ordinal (O1) axis.
DATA TYPE:
boolean
RANGE:
true / false; true = Draw major tick marks on the O1-axis, false = Do not draw
DEFAULT:
true
SYNTAX:
EXAMPLE:
This property controls the style of major tick marks that can be drawn on the primary ordinal (O1) axis with setO1MajorTickDisplay (true).
DATA TYPE:
integer
RANGE:
0...4; 0/1/3 = Small tick marks from frame edge outward, 2 = Small tick marks from frame edge inward, 4 = Small tick marks span across the frame edge
DEFAULT:
Zero (Normal grid lines)
SYNTAX:
EXAMPLE:
This property controls the number of minor grid lines between the major grid lines on the O1 axis.
DATA TYPE:
integer
RANGE:
1...50
DEFAULT:
1
SYNTAX:
EXAMPLE:
setDepthRadius(0);
setY1MajorGridDisplay(false);
setO1MajorGridStyle(4);
setO1MinorGridDisplay(true);
setLineWidth(getO1MinorGrid(),4);
setBorderColor(getO1MinorGrid(),new
Color(255,0,0));
setO1MinorGridCount(2);
setO1MinorGridCount(3);
ALSO SEE:
This property enables (true) / disables (false) the drawing of minor grid lines on the primary ordinal (O1) axis (i.e., lines attached to a text-based axis, "bottom" axis of a bar graph). O1MinorGridStyle defines the style of minor grid lines. The primary ordinal axis can have major and minor grid lines. In the default configuration, major grid lines are drawn and minor grid lines are not.
DATA TYPE:
boolean
RANGE:
true / false; true = Draw minor grid lines on the O1-axis, false = Do not draw minor grid lines
DEFAULT:
false
SYNTAX:
EXAMPLE:
setDepthRadius(0);
setY1MajorGridDisplay(false);
setO1MajorGridStyle(4);
setLineWidth(getO1MinorGrid(),4);
setBorderColor(getO1MinorGrid(),new
Color(255,0,0));
setO1MinorGridCount(2);
setO1MinorGridDisplay(true);
setO1MinorGridDisplay(false);
ALSO SEE:
O1AxisSide, O1MajorGridDisplay, O1MajorGridStyle, O1MinorGridStyle
This property controls the style of the minor grid lines on the primary ordinal (O1) axis. The primary ordinal axis can have major and minor grid lines. Different styles should be selected for major and minor grid lines so the user can distinguish between the two.
DATA TYPE:
integer
RANGE:
0...4; 0 = Normal grid lines, height of frame, 1 = Normal grid lines extend beyond the height of frame, 2 = Small tick marks from frame edge inward, 3 = Small tick marks from frame edge outward, 4 = Small tick marks span across the frame edge
DEFAULT:
Zero (Normal grid lines)
SYNTAX:
EXAMPLE:
setDepthRadius(0);
setY1MajorGridDisplay(false);
setO1MajorGridStyle(0);
setO1MinorGridDisplay(true);
setLineWidth(getO1MinorGrid(),4);
setBorderColor(getO1MinorGrid(),new
Color(0,255,0));
setO1MinorGridStyle(3);
setO1MinorGridStyle(1);
ALSO SEE:
O1AxisSide, O1MajorGridDisplay, O1MajorGridStyle, O1MinorGridDisplay, get/setGridStyle()
This property controls the number of minor tick marks to draw between major tick marks on the O1 axis.
DATA TYPE:
integer
RANGE:
1...50
DEFAULT:
1
SYNTAX:
EXAMPLE:
setDepthRadius(0);
setDepthAngle(0);
setGraphType(41);
setO1MajorGridDisplay(false);
setO1MajorTickDisplay(true);
setO1MinorTickDisplay(true);
setTickLength(getO1MajorTick(), 1000);
setBorderColor(getO1MajorTick(), new Color (255,0,0));
setO1MinorTickCount(2);
setO1MajorTickStyle(2);
setO1MinorTickStyle(1);
This property enables (true) / disables (false) drawing of minor tick marks on the primary ordinal (O1) axis.
DATA TYPE:
boolean
RANGE:
true / false; true = Draw minor tick marks on the O1-axis, false = Do not draw
DEFAULT:
true
SYNTAX:
This property controls the style of minor tick marks that can be drawn on the primary ordinal (O1) axis with setO1MinorTickDisplay (true).
DATA TYPE:
integer
RANGE:
0...4; 0/1/3 = Small tick marks from frame edge outward, 2 = Small tick marks from frame edge inward, 4 = Small tick marks span across the frame edge
DEFAULT:
Zero (Normal grid lines)
SYNTAX:
EXAMPLE:
These properties enable/disable automatic fitting and sizing of the O1- and O2-axis title.
DATA TYPE:
boolean
RANGE:
true / false; true = Automatically fit/size the O1-Axis title, false = Do not autofit
DEFAULT:
true
SYNTAX:
EXAMPLE:
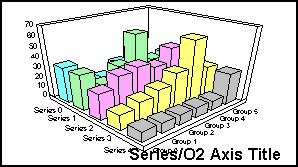
setO2TitleDisplay(true);
setO2LabelAutofit(true);
setFontSizeVC(getO2Title(),2782);
setFontStyle(getO2Title(),2);
setGraphType(0);
setO2TitleString("Series/O2 Axis Title");
setO2TitleAutofit(false);
ALSO SEE:
O1AxisSide, O1/O2LabelDisplay, O1/O2TitleDisplay, O1/O2TitleString, setFontSizeVC()
These properties control drawing of the O1-axis and O2-axis title strings. The O1/O2LabelDisplay property MUST also be set to true in order for the axis title to be displayed.
DATA TYPE:
boolean
RANGE:
true / false; true = Draw title, false = Do not draw title
DEFAULT:
false
SYNTAX:
EXAMPLE:
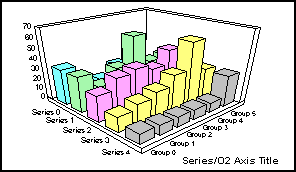
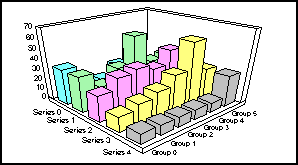
setO2TitleDisplay(true);
setGraphType(0);
setO2TitleString("Series/O2 Axis Title");
setO2TitleDisplay(false);
NOTE:
If O1/O2LabelDisplay is false, the title will not be drawn regardless of the O1/O2TitleDisplay or O1/O2TitleString properties.
ALSO SEE:
O1AxisSide, O1/O2LabelDisplay, O1/O2TitleAutofit, O1/O2TitleString
These properties define the O1-axis and O2-axis title strings.
DATA TYPE:
string
RANGE:
Any printable characters
DEFAULT:
null string
SYNTAX:
EXAMPLE:
setFootnoteDisplay(false);
setO2TitleDisplay(true);
setFontStyle(getO2Title(),2);
setGraphType(0);
setO2TitleString("Series/O2 Axis Title");
NOTE:
O1AxisSide defines where the O1TitleString is drawn. When a title string is defined, O1TitleDisplay will automatically be set to true.
ALSO SEE:
O1AxisSide, O1/O2LabelDisplay, O1/O2TitleAutofit, O1/O2TitleDisplay