
These properties control the direction of a numeric axis. When false, values ascend normally -- from left-to-right on the X-axis or a Y-Axis in a horizontal chart, from bottom-to-top on a Y-axis in a vertical chart. When true, values are reversed and descend from right-to-left on the X-axis or a Y-axis in a horizontal chart. A Y-axis in a vertical chart draws from top-to-bottom. These properties also reverse the order of the axis labels and changes all data-related objects (e.g., markers) from their previous state.
DATA TYPE:
boolean
RANGE:
true / false; true = Draw axis labels in descending order, false = Draw axis labels in ascending order
DEFAULT:
false
SYNTAX:
EXAMPLE:
ALSO SEE:
These properties control the appearance of a numeric axis base line. The X1/Y1/Y2AxisSide properties control where the axis base line is drawn.
DATA TYPE:
boolean
RANGE:
true / false; true = Draw axis base line, false = Do not draw axis base line
DEFAULT:
true
SYNTAX:
EXAMPLE:
EXAMPLE:
setDepthAngle(0);
setDepthRadius(0);
setGraphType(21);
setY2AxisLineDisplay(true);
setLineWidth(getY2AxisLine(),8);
NOTE:
In the default configuration, the axis base line is the same width and location as the chart frame. When this line size is used, this property does not change the appearance of the chart. To make a thicker, more visible axis base line, use the setLineWidth() method to increase the width of the line.
ALSO SEE:
These property control which side of the graph where a numeric axis base line, labels, and titles will be imaged.
DATA TYPE:
integer
RANGE:
0...2; 0 = Image to low side of graph (bottom or left), 1 = Image to high side of graph (top or right), 2 = Image to both sides.
DEFAULT:
Zero
SYNTAX:
EXAMPLE:
ALSO SEE:
These properties exclude (true) or include (false) the maximum label on a numeric axis.
DATA TYPE:
boolean
RANGE:
true / false; true = Exclude maximum label, false = Include maximum label
DEFAULT:
false
SYNTAX:
EXAMPLE:
NOTE:
These properties will not affect the appearance of the graph if drawing of numeric axis labels has been disabled with setX1/Y1/Y2LabelDisplay(false).
ALSO SEE:
These properties exclude or include the minimum label on a numeric axis.
DATA TYPE:
boolean
RANGE:
true / false; true = Exclude maximum label, false = Include maximum label
DEFAULT:
false
SYNTAX:
EXAMPLE:
NOTE:
These properties will not affect the appearance of the graph if drawing of numeric axis labels has been disabled with setX1/Y1/Y2LabelDisplay(false).
ALSO SEE:
These properties are used to automatically fit/size all numeric axis labels. When automatic fit/size is enabled (the default), the font size of these objects cannot be changed to a size that is larger than the relative location/size of the object and objects around it. Labels are automatically sized using the boundaries set by TextAutofitMax and TextAutofitMin. When autofitting is disabled, the font size can be set to any value allowing very large font sizes to overlap other objects in the graph. Use setFontSize() or setFontSizeVC() to set the size of the font of labels when autofitting is disabled. If autofitting is enabled, values set by setFontSize() or setFontSizeVC() for the numeric axis labels will be ignored.
DATA TYPE:
boolean
RANGE:
true / false; true = enable automatic fit/size, false = disable automatic fit/size
DEFAULT:
true
SYNTAX:
EXAMPLE:
ALSO SEE:
These properties enable (true) / disable (false) labels on a numeric axis. When enabled, the X1/Y1/Y2AxisSide properties determine the location of the labels.
DATA TYPE:
boolean
RANGE:
true / false; true = Draw axis labels and title, false = Do not draw
DEFAULT:
true
SYNTAX:
EXAMPLE:
setDepthAngle(0);
setDepthRadius(0);
setLegendDisplay(false);
setGraphType(21);
setY2LabelDisplay(false);
setY2LabelDisplay(true);
ALSO SEE:
These properties define the format of data labels on a numeric axis.
DATA TYPE:
integer
RANGE:
-1...21.
Value
Description
-1
Use the pattern defined by X1/Y1/Y2LabelFormatPattern
0/1 =
# (e.g., 123 = 123)
2 =
#% (e.g., 123 = 12,300%)
3 =
#.#% (e.g., 123 = 12,300.0%)
4 =
#.##% (e.g., 123 = 12,300.00%)
5 =
$#.## (e.g., 123 = $123.00)
6 =
$# (e.g., 123 = $123)
7 =
#K (Show K for values over 999) (e.g., 1,234 = 1K)
8 =
$#K (Show K for values over 999) (e.g., 1,234 = $1K)
9 =
#M (Show M for millions)(e.g., 1,234,567 = 1M)
10 =
$#M (Show M for millions)(e.g., 1,234,567 = $1M)
11 =
#B (Show B for billions)(e.g., 1,234,567,891 = 1B)
12 =
$#B (Show B for billions)(e.g., 1,234,567,891 = $1B)
13 =
#T (Show T for trillions)(e.g., 1,234,567,891,234 = 1T)
14 =
$#T (Show T for trillions)(e.g., 1,234,567,891,234 = $1T)
15 =
Number with thousands separators, no decimal places(e.g., 1,234 = 1K)
16 =
Number with thousands separators, two decimal places (e.g., 1,234 = 1.23K)
17 =
General currency format for current Locale
18 =
Short Date Format: MM/DD/YY (e.g., 10/01/03)
19 =
Medium Date Format: Mon. DD, YYYY (e.g., Oct. 01, 2003)
20 =
Long Date Format: Month DD, YYYY (e.g., October 01, 2003)
21 =
Full Date Format: Day, Month DD, YYYY(e.g., Wednesday, October 01, 2003)
DEFAULT:
0 (General)
SYNTAX:
ALSO SEE:
When X1LabelFormat, Y1LabelFormat, or Y2LabelFormat is minus one, use one of these properties to define a standard Java data text format.
DATA TYPE:
string
RANGE:
A pattern string in the following format:
pattern:= subpattern{;subpattern}
subpattern:= {prefix}integer{.fraction}{suffix}
prefix:= '\\u0000'..'\\uFFFD' - specialCharacters
suffix:= '\\u0000'..'\\uFFFD' - specialCharacters
integer:= '#'* '0'* '0'
fraction:= '0'* '#'*
Where:
X*
0 or more instances of X
(X|Y)
either X or Y.
X..Y
any character from X up to Y, inclusive.
S - T
characters in S, except those in T
The first subpattern is for positive numbers. The second (optional) subpattern is for negative numbers. In both cases, a comma(,) can occur inside the integer portion. The special characters used in the parts of the subpattern are:
0
a digit
#
a digit, zero shows as absent
.
a period(.) is a placeholder for decimal separator
,
a comma(,) is a placeholder for grouping separator
;
a semicolon(;) separates formats
-
a minus sign/dash(-) is the default negative prefix
%
divide by 100 and show as percentage
x
any other characters can be used in the prefix or suffix
'
a single quote(') is used to quote special characters in a prefix or suffix
If there is no explicit negative subpattern, a minus sign(-) is prefixed to the positive form (i.e, "0.00" alone is equivalent to "0.00;-0.00"). Illegal formats, such as "#.#.#" or mixing '_' and '*' in the same format, will cause a ParseException. The ParseException string will show where the error occurred. The grouping separator is commonly used for thousands, but in some countries for ten-thousands. The interval is a constant number of digits between the grouping characters (e.g., 100,000,000 or 1,0000,0000). If you supply a pattern with multiple grouping characters, the interval between the last one and the end of the integer is the one that is used. So "#,##,###,####" == "######,####" == "##,####,####". This class only handles localized digits where the 10 digits are contiguous in Unicode, from 0 to 9.
DEFAULT:
"#.#"
SYNTAX:
ALSO SEE:
These properties can be used to rotate labels on a numeric axis.
DATA TYPE:
integer
RANGE:
0...2; 0 = No text rotation, 1 = Rotate text 90 degrees (reads top to bottom), 2 = Rotate text 270 degrees (reads bottom to top), 3 = Rotate text 45 degrees
DEFAULT:
Zero (no text rotation)
SYNTAX:
EXAMPLE:
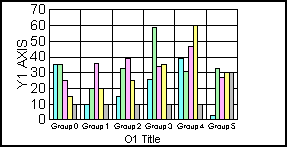
setX1LabelRotate(2);
setMarkerSizeDefault(60);
setY1MajorGridDisplay(false);
setGraphType(61);
setX1LabelFormat(-1);
setY1AxisLineDisplay(false);
setX1LabelFormatPattern("%#.#");
setX1MajorGridDisplay(false);
ALSO SEE:
X1/Y1/Y2LabelAutofit, X1/Y1/Y2LabelDisplay, X1/Y1/Y2LabelFormat, X1/Y1/Y2LabelStagger
These properties specify whether or not text for a numeric axis should be staggered. Staggered labels are drawn in a zigzag fashion, with labels weaving in and under each other.
DATA TYPE:
boolean
RANGE:
true / false; true = Stagger labels, false = Draw labels on one line
DEFAULT:
false
SYNTAX:
EXAMPLE:
setGraphType(21);
setY2LabelStagger(true);
setDepthAngle(0);
setLegendDisplay(false);
setDepthRadius(0);
setY2LabelStagger(false);
ALSO SEE:
X1/Y1/Y2LabelAutofit, X1/Y1/Y2LabelDisplay, X1/Y1/Y2LabelFormat, X1/Y1/Y2LabelRotate, get/setLabelStagger()
These properties specify the scale (logarithmic or linear) for a numeric axis. When the scale range is set to automatic, any data items with values less than or equal to zero are graphed as null for log scale. If a manual scale range is specified to include negative values (X1/Y1/Y2/Y3/Y4ScaleMin less than or equal to zero), the request for log scale is ignored. The log scale is automatically set to false (linear scale).
DATA TYPE:
boolean
RANGE:
true / false; true = Use logarithmic scale, false = Use linear scale
DEFAULT:
false
SYNTAX:
EXAMPLE:
ALSO SEE:
These properties control whether or not major grid lines are displayed on a numeric axis. A numeric axis can have major and minor grid lines. In the default configuration, major grid lines are drawn and minor grid lines are not drawn. Use the The X1/Y1/Y2MajorGridStep properties control the number of grid lines that are drawn when this property is enabled.
DATA TYPE:
boolean
RANGE:
true / false; true = Draw major grid lines on the X-axis, false = Do not draw major grid lines on the X-axis
DEFAULT:
true
SYNTAX:
EXAMPLE:
ALSO SEE:
X1/Y1/Y2MajorGridStep, X1/Y1/Y2MajorGridStyle, X1/Y1/Y2MinorGridDisplay, X1/Y1/Y2MinorGridStyle
These properties control the number of major grid lines/steps that will be imaged on a numeric axis. For example, grid steps 1, 6, 11, 16, ...51 will be imaged if the range of values in the chart is 1...51 and the number of grid steps is set to 5. If the number of grid steps set to 10, grid steps 1, 11, 21, 31...51 would be displayed. When a number of grid steps is set with one of these properties, the corresponding ...MajorGridStepAuto property will be set to false.
DATA TYPE:
double
RANGE:
Any Positive Number (See Notes)
DEFAULT:
15.0
SYNTAX:
EXAMPLE:
NOTE:
If the the number of grid steps is negative or results in greater than 50 grid lines, X1/Y2/Y2MajorGridStepAuto is automatically set to true and the X1/Y1/Y2MajorGridStep value is ignored.
ALSO SEE:
X1/Y1/Y2MajorGridStepAuto, X1/Y1/Y2MinorGridStep, X1/Y1/Y2MinorGridStepAuto, get/setGridStep(), get/setGridStepAuto()
These properties enable (true) / disable (false) automatic calculation of the number of major grid lines on a numeric axis. When true, the value assigned to the corresponding X1/Y1/Y2MajorGridStep property is ignored. Also see Notes below.
DATA TYPE:
boolean
RANGE:
true / false; true = Automatically calculate the number of grid steps, false = Use the value set by X1/Y1/Y2MajorGridStep
DEFAULT:
true
SYNTAX:
EXAMPLE:
setX1MajorGridStep(20.0);
NOTE:
If the value assigned to X1MajorGridStep is negative or results in greater than 50 grid lines, the X1MajorGridStepAuto property is automatically set to true and the X1MajorGridStep value is ignored.
ALSO SEE:
X1/Y1/Y2MajorGridStep, X1/Y1/Y2MinorGridStep, X1/Y1/Y2MinorGridStepAuto, get/setGridStep(), get/setGridStepAuto()
These properties control the appearance of major grid lines on a numeric axis. Grid lines can be small ticks at the base of the axis line or lines that extend to the height of the chart frame. Major grid lines are normally set to a different style than minor grid lines so that the user can distinguish between the two.
DATA TYPE:
integer
RANGE:
0...4; 0 = Normal grid lines, height of frame, 1 = Normal grid lines extend beyond the height of frame, 2 = Small tick marks from frame edge inward, 3 = Small tick marks from frame edge outward, 4 = Small tick marks span across the frame edge
DEFAULT:
Zero
SYNTAX:
EXAMPLE:
setX1MajorGridStyle(4);
ALSO SEE:
X1/Y1/Y2MajorGridDisplay, X1/Y1/Y2MinorGridDisplay, X1/Y1/Y2MinorGridStyle, get/setGridStyle()
These properties enable (true) / disable (false) drawing of major tick marks on a numeric axis.
DATA TYPE:
boolean
RANGE:
true / false; true = Draw major tick marks, false = Do not draw major tick marks
DEFAULT:
false
SYNTAX:
When major tick marks are enabled on a numeric axis, these properties define the interval at which tick marks are drawn.
DATA TYPE:
double
RANGE:
Any Positive Number
DEFAULT:
10.0
SYNTAX:
EXAMPLE:
setDepthRadius(0);
setDepthAngle(0);
setY1MajorGridDisplay(false);
setY1MajorTickDisplay(true);
setY1MajorTickStep(4.5);
These properties enable (true) / disable (false) automatic calculation of major tick marks on a numeric axis.
DATA TYPE:
boolean
RANGE:
true / false; true = Automatically calculate the number of tick steps, false = Use the value set by X1, Y1, or Y2MajorTickStep
DEFAULT:
false
SYNTAX:
When major tick marks are drawn on a numeric axis, these properties define the style of major tick marks.
DATA TYPE:
integer
RANGE:
0...4; 0/1/3 = Small tick marks from frame edge outward, 2 = Small tick marks from frame edge inward, 4 = Small tick marks span across the frame edge
DEFAULT:
Zero
SYNTAX:
These properties enable (true) / disable (false) drawing of minor grid lines on a numeric axis. A numeric axis can have major and minor grid lines. In the default configuration, major grid lines are drawn and minor grid lines are not drawn.
DATA TYPE:
boolean
RANGE:
true / false; true = Draw minor grid lines, false = Do not draw minor grid lines
DEFAULT:
false
SYNTAX:
ALSO SEE:
X1/Y1/Y2MajorGridDisplay, X1/Y1/Y2MinorGridStep, X1/Y1/Y2MinorGridStepAuto, X1/Y1/Y2MinorGridStyle, get/setGridStyle()
These properties set a number of minor grid steps on a numeric axis. Minor grid lines are drawn between the major grid lines (when they are displayed) and the location of the minor gridlines depend very much on the setting for the major grid lines. When a number of minor grid steps is defined with one of these properties, the corresponding X1, Y1, or Y2MinorGridStepAuto property is automatically set to false. If the number of minor grid steps results in greater than 50 minor grid lines between each major grid line, the corresponding X1, Y1, or Y2MinorGridStepAuto property is automatically set to true.
DATA TYPE:
double
RANGE:
Any Positive Number (See Note)
DEFAULT:
15.0
SYNTAX:
EXAMPLE:
setX1MinorGridStep(4);
NOTE:
If the number of minor grid steps is set to a negative value or a value that results in greater than 50 minor grid lines between each major grid line, the corresponding X1, Y1, or Y2MinorGridStepAuto property is automatically set to true.
ALSO SEE:
X1/Y1/Y2MinorGridStepAuto, X1/Y1/Y2MajorGridStep, X1/Y1/Y2MajorGridStepAuto, get/setGridStep(), get/setGridStepAuto()
These properties enable/disable automatic calculation of the number of minor grid lines on a numeric axis. When true, the value assigned to the corresponding X1, Y1, or Y2MinorGridStep property is ignored.
DATA TYPE:
boolean
RANGE:
true / false; true = Automatically calculated the number of grid lines on the X-axis, false = Use the value set by X1MinorGridStep
DEFAULT:
true
SYNTAX:
EXAMPLE:
setX1MinorGridStepAuto(false);
NOTE:
If the number of grid steps set by X1, Y1, or Y2MinorGridStep is negative or results in greater than 50 minor grid lines between each major grid line, the corresponding X1, Y1, or Y2MinorGridStepAuto property is automatically set to true.
ALSO SEE:
X1/Y1/Y2MinorGridStep, X1/Y1/Y2MajorGridStep, X1/Y1/Y2MajorGridStepAuto, get/setGridStep(), get/setGridStepAuto()
These properties control the appearance of minor grid lines on a numeric axis. Grid lines can be small ticks at the base of the axis line or lines that extend to the height of the chart frame. Minor grid lines are normally set to a different style than major grid lines so that the user can distinguish between the two.
DATA TYPE:
integer
RANGE:
0...4; 0 = Normal grid lines, height of frame, 1 = Normal grid lines extend beyond the height of frame, 2 = Small tick marks from frame edge inward, 3 = Small tick marks from frame edge outward, 4 = Small tick marks span across the frame edge
DEFAULT:
Zero (Normal Grid)
SYNTAX:
EXAMPLE:
setX1MinorGridStyle(3);
ALSO SEE:
X1/Y1/Y2MinorGridDisplay, X1/Y1/Y2MinorGridStep, X1/Y1/Y2MinorGridStepAuto, X1/Y1/Y2MajorGridStyle, X1/Y1/Y2MajorGridDisplay, get/setGridStyle()
These properties enable (true) / disable (false) drawing of minor tick marks on a numeric axis.
DATA TYPE:
boolean
RANGE:
true / false; true = Draw minor tick marks, false = Do not draw minor tick marks
DEFAULT:
false
SYNTAX:
When minor tick marks are enabled, these properties define the interval at which minor tick marks are drawn.
DATA TYPE:
double
RANGE:
any positive number
DEFAULT:
10.0
SYNTAX:
EXAMPLE:
setDepthAngle(0);
setDepthRadius(0);
setX1MajorGridDisplay(false);
setY1MajorGridDisplay(false);
setMarkerSizeDefault(50);
setX1MinorTickDisplay(true);
setTickLength(getX1MinorTick(), 1000);
setX1MinorTickStep(5.0);
These properties enable (true) / disable (false) automatic calculation of minor tick marks on a numeric axis.
DATA TYPE:
boolean
RANGE:
true / false; true = Automatically calculate the number of tick steps, false = Use the value set by X1, Y1, or Y2MinorTickStep
DEFAULT:
true
SYNTAX:
When minor tick marks are drawn on a numeric axis, these properties define the style of minor tick marks.
DATA TYPE:
integer
RANGE:
0...4; 0/1/3 = Small tick marks from frame edge outward. 2 = Small tick marks from frame edge inward, 4 = Small tick marks span across the frame edge
DEFAULT:
Zero
SYNTAX:
These properties determine whether or not a numeric axis includes zero. If the logarithmic scale is enabled with X1, Y1, or Y2LogScale(true) or a manual scale range excludes zero (X1/Y1/Y2ScaleMax and X1/Y1/Y2ScaleMin are greater than zero), this property is ignored.
DATA TYPE:
boolean
RANGE:
true / false; true = Include Zero, false = Exclude Zero if it is not within the given automatic scale range.
DEFAULT:
false
SYNTAX:
EXAMPLE:
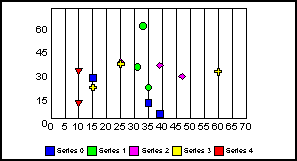
setGraphType(21);
setDepthRadius(0);
setY2MustIncludeZero(false);
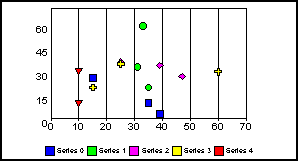
setGraphType(21);
setDepthRadius(0);
setY2MustIncludeZero(true);
These properties enable/disable the display of values that are out of range by clipping them to fit within the range. When this property is enabled (true), values smaller than or greater than a given range are represented as markers or risers at the scale limit (minimum or maximum). For example, a value of 700 goes beyond the specified range of 250-500, so its marker in a scatter chart would be displayed at the right edge of the chart. When this property is disabled (false), only values that fall directly between a given range are displayed (e.g. in the example above, the 700 marker would be omitted.)
DATA TYPE:
boolean
RANGE:
true / false; true = Display out-of-range values at scale limit (minimum or maximum), false = Only display values that fall between a given range
DEFAULT:
true
SYNTAX:
EXAMPLE:
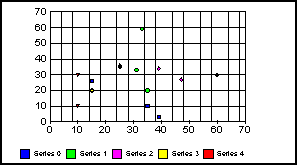
setY1ScaleMax(40.0);
setY1OffScaleDisplay(false);
setY1OffScaleDisplay(true);
ALSO SEE:
These properties specify the maximum data value that can be used to image the graph and its axis. When a maximum scale value is specified, the associated X1/Y1/Y2ScaleMaxAuto property is automatically set to false.
DATA TYPE:
double
RANGE:
Any value
DEFAULT:
100
SYNTAX:
EXAMPLE:
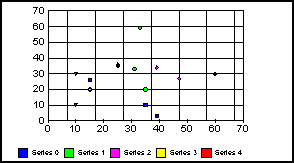
setGraphType(21);
setY2ScaleMaxAuto(false);
setDepthAngle(0);
setY2ScaleMax(60.0);
setLegendDisplay(false);
setY2OffScaleDisplay(true);
setDepthRadius(0);
setY2ScaleMax(100);
NOTE:
If X1/Y1/Y2ScaleMax is set to a value less than X1/Y1/Y2ScaleMin, the values will be automatically switched and the associated X1/Y1/Y2AxisDescending property will be set to true.
ALSO SEE:
These properties enable (true) / disable (false) use of the value assigned to the associated X1/Y1/Y2ScaleMax property.
DATA TYPE:
boolean
RANGE:
true / false; true = Automatically calculate maximum scale, false = Use value set by X1/Y1/Y2ScaleMax
DEFAULT:
true
SYNTAX:
EXAMPLE:
setY1ScaleMaxAuto(false);
setDepthAngle(0);
setY1ScaleMax(20.0);
setLegendDisplay(false);
setY1OffScaleDisplay(true);
setDepthRadius(0);
ALSO SEE:
These properties specify the minimum data value that can be used to manually image the graph and its axis. When a value is assigned to this property, the associated X1/Y1/Y2ScaleMinAuto property is automatically set to false.
DATA TYPE:
double
RANGE:
Any number
DEFAULT:
0.0
SYNTAX:
EXAMPLE:
setX1ScaleMin(4);
NOTE:
If X1/Y1/Y2ScaleMax is set to a value less than X1/Y1/Y2ScaleMin, the values will be automatically switched and the associated X1/Y1/Y2AxisDescending property will be set to true.
ALSO SEE:
X1/Y1/Y2ScaleMinAuto, X1/Y1/Y2ScaleMax, X1/Y1/Y2ScaleMaxAuto, get/setScaleMin(), get/setScaleMinAuto()
These properties enable (true) /disable (false) automatic minimum scaling.
DATA TYPE:
boolean
RANGE:
true / false; true = automatically calculate minimum scale, false = use the value set by X1/Y1/Y2ScaleMin
DEFAULT:
true
SYNTAX:
EXAMPLE:
setDepthAngle(0);
setY1ScaleMinAuto(false);
setLegendDisplay(false);
setY1ScaleMin(10.0);
setDepthRadius(0);
setY1ScaleMinAuto(true);
ALSO SEE:
X1/Y1/Y2ScaleMin, X1/Y1/Y2ScaleMax, X1/Y1/Y2ScaleMaxAuto, get/setScaleMin(), get/setScaleMinAuto()
These properties enable (true) /disable (false) automatic fitting of a numeric axis title.
DATA TYPE:
boolean
RANGE:
true / false; true = Automatically fit/size title string, false = Allow title string to be any size
DEFAULT:
true
SYNTAX:
EXAMPLE:
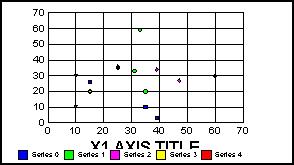
setGraphType(61);
setX1Titlestring("X1 AXIS TITLE");
setX1TitleDisplay(true);
setX1TitleAutofit(false);
setFontSizeVC(getX1Title(), 3000);
setX1TitleAutofit(true);
ALSO SEE:
These properties enable (true) /disable (false) drawing of a numeric axis title string that is defined by the X1/Y1/Y2Titlestring properties.
DATA TYPE:
boolean
RANGE:
true / false; true = Draw title string, false = Do not draw title
DEFAULT:
false
SYNTAX:
EXAMPLE:
setGraphType(21);
setDepthAngle(0);
setY2TitleDisplay(true);
setY2Titlestring("Y2 AXIS");
setDepthRadius(0);
setY2TitleDisplay(false);
NOTE:
If the associated X1/Y1/Y2LabelDisplay property is set to false, the title string will not be drawn regardless of the X1/Y1/Y2TitleDisplay or X1/Y1/Y2Titlestring property.
ALSO SEE:
These properties can be used to define the title string for a numeric axis. When a title string is assigned to this property, the associated X1/Y1/Y2TitleDisplay property is automatically set to true.
DATA TYPE:
string
RANGE:
Any printable characters
DEFAULT:
Null string
SYNTAX:
EXAMPLE:
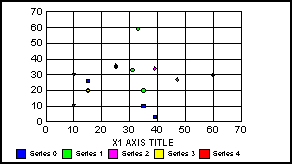
setGraphType(61);
setX1TitleString("X1 AXIS TITLE");
setX1TitleDisplay(true);
setDepthAngle(0);
setY1TitleDisplay(true);
setLegendDisplay(false);
setY1TitleString("Y1 AXIS");
setDepthRadius(0);
NOTE:
If the X1/Y1/Y2LabelDisplay property is false, the title string will not be drawn regardless of the X1/Y1/Y2TitleDisplay or X1/Y1/Y2Titlestring property.
ALSO SEE:
These properties enable/disable drawing of the zero line on a numeric axis when zero is within the axis scale range.
DATA TYPE:
boolean
RANGE:
true / false; true = Draw zero line, false = Do not draw zero line
DEFAULT:
false
SYNTAX:
EXAMPLE:
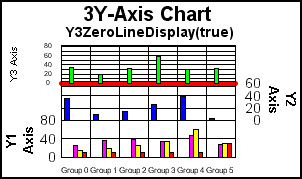
setDepthAngle(0);
setDepthRadius(0);
setFootnoteDisplay(false);
setAxisAssignment(getSeries(0), 1);
setAxisAssignment(getSeries(1), 2);
setGraphType(103);
setTitleString("3Y-Axis Chart");
setY1TitleString("Y1 Axis");
setY2TitleString("Y2 Axis");
setTextString(getY3Title(), "Y3 Axis");
setY3ZeroLineDisplay(true);
setLineWidth(getY3ZeroLine(), 5);
setFillColor(getY3ZeroLine(), new Color(255,0,0));
setSubtitleString("Y3ZeroLineDisplay(true)");
NOTE:
To increase the width of the zero line, use the setLineWidth() method to specify the width (in pixels) of the line object (e.g., getX1ZeroLine(), getY1ZeroLine(), etc.).
ALSO SEE: