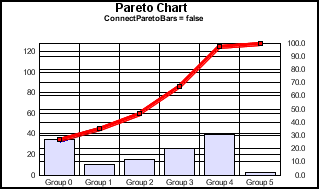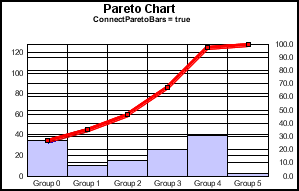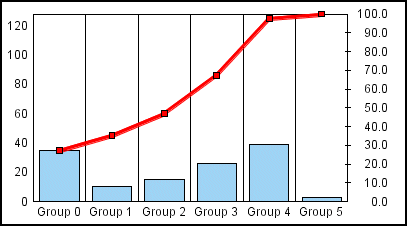

In a Pareto Chart (GraphType=102), this property affects how the Pareto series bars are drawn. When this property is set to true, Pareto bars are drawn connected with no space in between them. When this property is set to false, Pareto bars are drawn with space between them.
DATA TYPE:
boolean
RANGE:
true (Connect Pareto Bars) / false (Do not connect bars)
DEFAULT:
true (connect Pareto Bars)
SYNTAX:
EXAMPLE:
setDepthAngle(0);
setDepthRadius(0);
setFootnoteDisplay(false);
setDisplayParetoSeries (0);
setGraphType(102);
setTitleString("Pareto Chart");
setSubtitleString("ConnectParetoBars = false");
setConnectParetoBars(false);
setSubtitleString("ConnectParetoBars = true");
setConnectParetoBars(true);
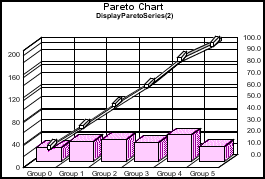
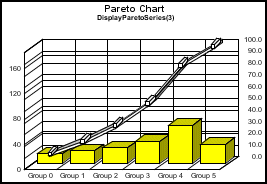
This property selects the series to be highlighted in a Pareto chart.
DATA TYPE:
integer
RANGE:
0...# of Series in data set
DEFAULT:
0
SYNTAX:
EXAMPLE:
setFootnoteDisplay(false);
setDisplayParetoSeries (2);
setGraphType(102);
setTitleString("Pareto Chart");
setSubtitleString("DisplayParetoSeries(2)");
setFootnoteDisplay(false);
setDisplayParetoSeries (3);
setGraphType(102);
setTitleString("Pareto Chart");
setSubtitleString("DisplayParetoSeries(3)");
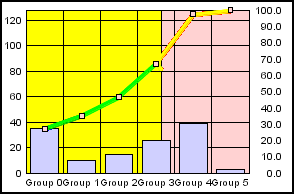
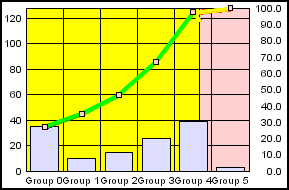
This property sets the location to to split the chart frame and accumulation line in a pareto chart.
DATA TYPE:
integer
RANGE:
0...100
DEFAULT:
1
SYNTAX:
EXAMPLE:
setTitleDisplay(false);
setSubtitleDisplay(false);
setFootnoteDisplay(false);
setDepthAngle(0);
setDepthRadius(0);
setGraphType(102);
setParetoDisplayThreshold(50);
setTitleDisplay(false);
setSubtitleDisplay(false);
setFootnoteDisplay(false);
setDepthAngle(0);
setDepthRadius(0);
setGraphType(102);
setParetoDisplayThreshold(90);
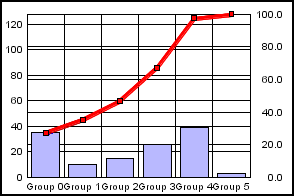
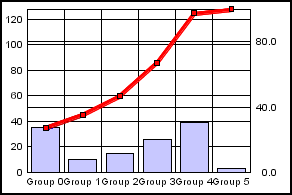
This property sets the interval of grid lines and labels on the Y2-axis in a pareto chart.
DATA TYPE:
double
RANGE:
1.0...500.0
DEFAULT:
10.0
SYNTAX:
EXAMPLE:
setTitleDisplay(false);
setSubtitleDisplay(false);
setFootnoteDisplay(false);
setDepthAngle(0);
setDepthRadius(0);
setGraphType(102);
setParetoDisplayThreshold(0);
setParetoY2MajorGridStep(20.0);
setTitleDisplay(false);
setSubtitleDisplay(false);
setFootnoteDisplay(false);
setDepthAngle(0);
setDepthRadius(0);
setGraphType(102);
setParetoDisplayThreshold(0);
setParetoY2MajorGridStep(40.0);
This property sets the interval of tick marks on the Y2-axis in a pareto chart.
DATA TYPE:
double
RANGE:
1.0...500.0
DEFAULT:
10.0
SYNTAX:
EXAMPLE:
setGraphType(102);
setDepthAngle(0);
setDepthRadius(0);
setDisplay(getY2MajorGrid(), false);
setDisplay(getY1MajorGrid(), false);
setParetoY2MajorTickStep(10.0);
setDisplay(getY2MajorTick(), true);