|
Class |
ObjectID |
Description |
|
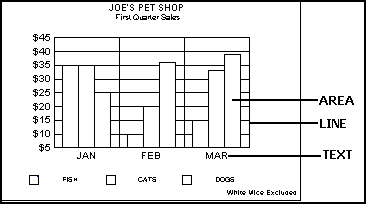
Area |
O2D_AREARISER |
Quantitative data representation in an area chart |
|
Line |
O2D_CONNECT_STACKLINE |
Line that connects stacked bars |
|
Line |
O2D_CURVE |
Quantitative data series interpolation line |
|
Line |
O2D_DATALINE |
Line connecting data markers of a line chart |
|
Area |
O2D_DATAMARKER |
Quantitative data representation point |
|
Text |
O2D_DATATEXT |
Text value of a quantitative data representation |
|
Line |
O2D_DATATEXT_CONNECTLINE |
Connecting line between data text and riser/marker. |
|
Text |
O2D_DATATEXT_STACK_TOTAL |
Stacked total in a stacked bar chart |
|
Line |
O2D_DIVBIPOLAR |
Line dividing bipolar chart surfaces |
|
Line |
O2D_ERRORBAR |
Line identifying values out of range |
|
Line |
O2D_LINR_EXP |
Exponential Linear Regression Line |
|
Line |
O2D_LINR_LINE |
Linear Regression Line |
|
Line |
O2D_LINR_LOG |
Logrithmic Linear Regression Line |
|
Line |
O2D_LINR_NATLOG |
Natural Logrithmic Linear Regression Line |
|
Line |
O2D_LINR_NPOLY |
Polynomial Linear Regression Line |
|
Text |
O2D_LINR_TEXT |
Formula Text associated with a Linear Regression Line |
|
Text |
O2D_MD_LABEL0...31 |
Multi-Dimensional Labels |
|
Line |
O2D_MEANLINE |
Histogram mean line |
|
Line |
O2D_MOVAVGLINE |
Quantitative data series moving average line |
|
Line |
O2D_O1_BODY |
Primary Ordinal Axis Base Line |
|
Text |
O2D_O1_LABEL |
Primary Ordinal Axis Label |
|
Line |
O2D_O1_MAJOR |
Primary Ordinal Axis Major Grid Line |
|
Line |
O2D_O1_MINOR |
Primary Ordinal Axis Minor Grid Line |
|
Line |
O2D_O1_SUPER |
Primary Ordinal Axis Super Grid Line |
|
Text |
O2D_O1_TITLE |
Primary Ordinal Axis Title |
|
Line |
O2D_O2_BODY |
Secondary Ordinal Axis Base Line |
|
Text |
O2D_O2_LABEL |
Secondary Ordinal Axis Label |
|
Line |
O2D_O2_MAJOR |
Secondary Ordinal Axis Major Grid Line |
|
Line |
O2D_O2_MINOR |
Secondary Ordinal Axis Minor Grid Line |
|
Line |
O2D_O2_TITLE |
Secondary Ordinal Axis Title |
|
Line |
O2D_PRESDL_CONN |
Pre-Series Dependent Connection Line |
|
Line |
O2D_PRESDL_CONNBRK |
Pre-Series Dependent Connection Line with breaks |
|
Line |
O2D_PRESDL_STEP |
Pre-Series Dependent Stair-Stepped Line |
|
Line |
O2D_PRESDL_STEPBRK |
Pre-Series Dependent Stair-Stepped Line with breaks |
|
Area |
O2D_RISER |
Quantitative data representation of a bar chart |
|
Area |
O2D_RISER2/3 |
2.5D Mode riser faces |
|
Area |
O2D_RISERSHADOW |
Visual effect for bar data representation |
|
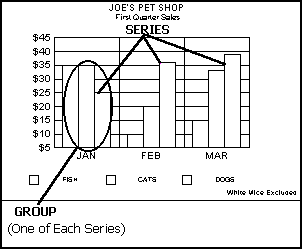
Text |
O2D_SERIES_TITLE |
Series title for legends |
|
Line |
O2D_STDDEVLINE |
Histogram standard deviation line(s) |
|
Line |
O2D_USERLINE1...4 |
User defined gridline |
|
Line |
O2D_X1_BODY |
X-Axis Base Line |
|
Text |
O2D_X1_LABEL |
X-Axis Label |
|
Line |
O2D_X1_MAJOR |
X-Axis Major Grid Line |
|
Line |
O2D_X1_MINOR |
X-Axis Minor Grid Line |
|
Text |
O2D_X1_TITLE |
X-Axis Title |
|
Line |
O2D_X1_ZERO |
X-Axis Zero Line |
|
Line |
O2D_Y1_BODY |
Y1-Axis Base Line |
|
Text |
O2D_Y1_LABEL |
Y1-Axis Label |
|
Line |
O2D_Y1_MAJOR |
Y1-Axis Major Grid Line |
|
Line |
O2D_Y1_MINOR |
Y1-Axis Minor Grid Line |
|
Text |
O2D_Y1_TITLE |
Y1-Axis Title |
|
Line |
O2D_Y1_ZERO |
Y1-Axis Zero Line |
|
Line |
O2D_Y2_BODY |
Y2-Axis Base Line |
|
Text |
O2D_Y2_LABEL |
Y2-Axis Label |
|
Line |
O2D_Y2_MAJOR |
Y2-Axis Major Grid Line |
|
Line |
O2D_Y2_MINOR |
Y2-Axis Minor Grid Line |
|
Text |
O2D_Y2_TITLE |
Y2-Axis Title |
|
Line |
O2D_Y2_ZERO |
Y2-Axis Zero Line |
|
Line |
O2D_Y3_BODY |
Y3-Axis Base Line |
|
Text |
O2D_Y3_LABEL |
Y3-Axis Label |
|
Line |
O2D_Y3_MAJOR |
Y3-Axis Major Grid Line |
|
Line |
O2D_Y3_MINOR |
Y3-Axis Minor Grid Line |
|
Text |
O2D_Y3_TITLE |
Y3-Axis Title |
|
Line |
O2D_Y3_ZERO |
Y3-Axis Zero Line |
|
Line |
O2D_Y4_BODY |
Y4-Axis Base Line |
|
Text |
O2D_Y4_LABEL |
Y4-Axis Label |
|
Line |
O2D_Y4_MAJOR |
Y4-Axis Major Grid Line |
|
Line |
O2D_Y4_MINOR |
Y4-Axis Minor Grid Line |
|
Text |
O2D_Y4_TITLE |
Y4-Axis Title |
|
Line |
O2D_Y4_ZERO |
Y4-Axis Zero Line |
|
Text |
O3D_COLHEADER |
Text associated with a data group (column) |
|
Text |
O3D_COLHEADER_2D |
2D text version of column header |
|
Area |
O3D_COLHEADER_BOX |
Optional box behind O3D_COLHEADER |
|
Text |
O3D_COLTITLE |
Title associated with all data groups |
|
Text |
O3D_COLTITLE_2D |
2D text version of column title |
|
Area |
O3D_COLTITLE_BOX |
Optional box behind O3D_COLTITLE |
|
Text |
O3D_DATALABEL |
Text label used mainly for scatter graph |
|
Area |
O3D_DATALABEL_BOX |
Box for O3D_DATALABEL |
|
Area |
O3D_DATAMARKER |
2D Marker used for scatter graphs |
|
Area |
O3D_FLOOR1...3 |
Front and back faces of graph's floor |
|
Line |
O3D_FRAMEGRID_X |
Tickline along x axis on graph cube/frame |
|
Line |
O3D_FRAMEGRID_Y |
Tickline along y axis on graph cube/frame |
|
Line |
O3D_FRAMEGRID_Z |
Tickline along z axis on graph cube/frame |
|
Area |
O3D_LASTRISERFACE |
Tenth face of a riser |
|
Area |
O3D_LEFTWALL1...3 |
Front and back faces of graph's left wall |
|
Text |
O3D_LYHEADER |
Text associated with left vertical axis (Y1) |
|
Text |
O3D_LYHEADER_2D |
2D text version of left header |
|
Text |
O3D_LYHEADER_BOX |
Optional box behind LYHEADER |
|
Text |
O3D_LYTITLE |
Title associated with left vertical axis (Y1) |
|
Text |
O3D_LYTITLE_2D |
2D text version of left title |
|
Text |
O3D_LYTITLE_BOX |
Optional box behind LYTITLE |
|
Area |
O3D_NEGATIVE_FILL |
In OpenGL, the transparant fill of the 3D cube for negative numbers. |
|
Area |
O3D_RIGHTWALL1...3 |
Front and back faces of graph's right wall |
|
Area |
O3D_RISERFACE1...9 |
First...Ninth face of a riser |
|
Line |
O3D_RISERGRID_X |
Tickline along x axis on risers |
|
Line |
O3D_RISERGRID_Y |
Tickline along y axis on risers |
|
Line |
O3D_RISERGRID_Z |
Tickline along z axis on risers |
|
Text |
O3D_ROWHEADER |
Text associated with a data series (row) |
|
Text |
O3D_ROWHEADER_2D |
2D text version of row header |
|
Area |
O3D_ROWHEADER_BOX |
Optional box behind O3D_ROWHEADER |
|
Text |
O3D_ROWTITLE |
Title associated with all data series |
|
Text |
O3D_ROWTITLE_2D |
2D text version of row title |
|
Area |
O3D_ROWTITLE_BOX |
Optional box behind O3D_ROWTITLE |
|
Text |
O3D_RYHEADER |
Text associated with right vertical axis |
|
Text |
O3D_RYHEADER_2D |
2D text version of right header |
|
Area |
O3D_RYHEADER_BOX |
Optional box behind O3D_RYTITLE |
|
Text |
O3D_RYTITLE |
Title for right vertical axis |
|
Text |
O3D_RYTITLE_2D |
2D text version of right title |
|
Area |
O3D_RYTITLE_BOX |
Optional box behind O3D_RYTITLE |
|
Line |
O3D_SCATTERLINE |
Line connecting scatter markers |
|
Line |
O3D_TIELINE_XX |
Line connecting markers to the left wall |
|
Line |
O3D_TIELINE_YY |
Line connecting markers to the floor |
|
Line |
O3D_TIELINE_ZZ |
Line connecting markers to the right wall |
|
Area |
O3D_VARIABLEFACE |
Any face of a variable face marker |
|
Area |
O5D_BACKGROUND |
Background of a Graph |
|
Area |
O5D_FRAME |
Graph Frame |
|
Text |
O5D_LBLFOOTNOTE |
Chart Footnote |
|
Text |
O5D_LBLSUBTITLE |
Chart Subtitle |
|
Text |
O5D_LBLTITLE |
Chart Title |
|
Annotation |
OAN_ARC |
Arc annotation object |
|
Annotation |
OAN_ARROW |
Arrow annotation object |
|
Annotation |
OAN_BALLOON |
Balloon object |
|
Annotation |
OAN_BALLOONPARA |
Balloon paragraph |
|
Annotation |
OAN_DBLTBOXIN |
Inside Double Text Box object |
|
Annotation |
OAN_DBLTBOXOUT |
Annotation object |
|
Annotation |
OAN_ELLIPSE |
Ellipse annotation object |
|
Annotation |
OAN_FREEHAND |
Arrow object |
|
Annotation |
OAN_LINE |
Line annotation object |
|
Annotation |
OAN_POLYGON |
Polygon annotation object |
|
Annotation |
OAN_POLYLINE |
Polyline annotation object |
|
Annotation |
OAN_RECTANGLE |
Rectangle annotation object |
|
Annotation |
OAN_ROUNDRECT |
Rounded Rectangle annotation object |
|
Annotation |
OAN_TEXT |
Annotation object |
|
Annotation |
OAN_THREEDTBOXFACE |
Face Of 3D Text Box object |
|
Annotation |
OAN_THREEDTBOXSIDES |
Sides Of 3D Text Box object |
|
Line |
OBL_QUADRANTLINE |
Quadrant Lines in a Bubble Chart |
|
Line |
OPI_BARCONNECT |
Line that connects pie to bar in pie bar |
|
Line |
OPI_FEELER |
Line drawn from a pie slice to a slice label |
|
Text |
OPI_LBL_VALUE |
Value Label associated with a slice in a pie chart |
|
Text |
OPI_LBLFEELER |
Text Label associated with slice in a pie chart |
|
Text |
OPI_LBLPIE |
Text associated with a pie |
|
Text |
OPI_LBLRING |
Text drawn in the center of a ring pie |
|
Area |
OPI_SLICE |
An individual slice in a pie (i.e., a quantitative data representation) |
|
Area |
OPI_SLICECRUST |
The outer edge of a pie slice |
|
Area |
OPI_SLICEFACE |
The top/face of a pie slice |
|
Area |
OPI_SLICERING |
The inside edge of a pie slice |
|
Area |
OPL_CIRCLEPOLARAXIS |
Circle polar axis |
|
Text |
OPL_LBLPOLARAXIS |
Polar Axis Label |
|
Line |
OPL_LINES |
Polar Lines |
|
Line |
OPL_THICKPOLARAXIS |
Polar Axis Thick |
|
Area |
OSG_LEGEND_AREA |
Legend Area |
|
Line |
OSG_LEGEND_LINE |
Legend Line |
|
Area |
OSG_LEGEND_MARKER |
Legend Marker |
|
Text |
OSG_LEGEND_TEXT |
Legend Text |
|
Area |
OSM_RISER |
Riser in a Stock Market chart |
|
Area |
OSP_SCALE_MARKER |
Scale Marker in a Spectral Map |
|
Line |
OTC_COLDIVISORS |
Lines separating full chart columns |
|
Area |
OTC_COLHEADAREA |
Surface beneath the column headers of a table chart |
|
Area |
OTC_COLMARKER |
Table Chart column marker |
|
Area |
OTC_DATAAREA |
Surface beneath the data text of a table chart |
|
Text |
OTC_LBLCELL |
Data text of a table chart |
|
Text |
OTC_LBLCOLHEAD |
Column header text of a table chart |
|
Text |
OTC_LBLROWHEAD |
Row header text of a table chart |
|
Text |
OTC_LBLROWTITLE |
Row title text associated with row headers |
|
Line |
OTC_ROWDIVISORS |
Lines separating full chart rows |
|
Area |
OTC_ROWHEADAREA |
Surface beneath the row headers of a table chart |
|
Area |
OTC_SUBJECTAREA |
Surface just above the row header surface area |
![]()
![]()
![]()

