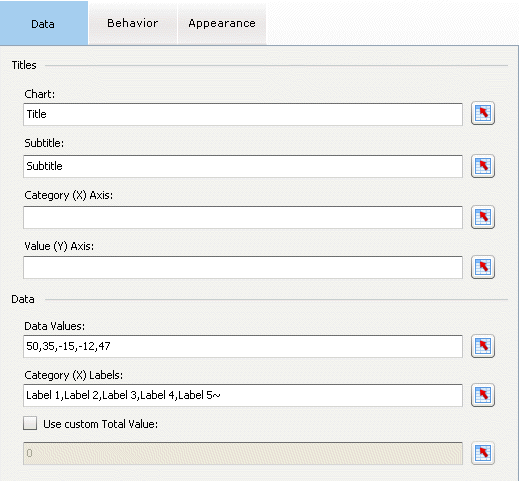
The Data tab in the properties panel defines chart titles and data that will be used to form the Waterfall chart risers, titles, and labels:
In all of these fields, you can enter information in the associated field or click the data button to choose data from one or more cells in the spreadsheet.
Chart: Enter text to draw in the chart title or click the data button to choose the chart title from a cell in the spreadsheet. The Text tab in the Appearance panel can be used to change the color and format of this title.
Subtitle: Enter text to draw in the chart subtitle or click the data button to choose the chart subtitle from a cell in the spreadsheet. The Text tab in the Appearance panel can be used to change the color and format of this title.
Category (X) Axis: Enter text to draw for the X-Axis title or click the data button to choose the X-Axis title from a cell in the spreadsheet. The X-Axis title is drawn below the category labels at the bottom of the chart. The Text tab in the Appearance panel can be used to change the color and format of this title.
Value (Y) Axis: Enter text to draw for the Y-Axis title or click the data button to choose the Y-Axis title from a cell in the spreadsheet. The Y-Axis title is drawn vertically next to the Y-Axis labels on the left side of the chart. The Text tab in the Appearance panel can be used to change the color and format of this title.
Data Values: Enter comma separated values or click the data button to choose data values from cells in the spreadsheet. The specified range of values will be used to form the risers that represent the initial value, positive values, negative values, and subtotal and other values (if identified by Category (X) Axis Labels). The TOTAL riser is auto-calculated based on the specified range of values.
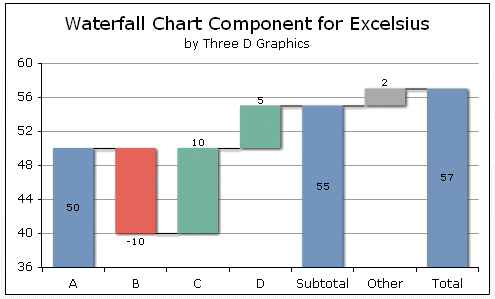
Category (X) Axis Labels: Enter comma separated text labels to draw on the category/x-axis or click the data button to choose labels from cells in the spreadsheet. If labels are not specified, the default configuration of the component is no label for the first/initial value riser, "Label 2" ... "Label n" for each value specified in the Data Values field, and "Total" for the total riser. If your data set includes a subtotal calculation, add a carat (^) suffix to the "Subtotal" label to draw this riser from the base of category/X-Axis. If your data set includes an additional value to add to the subtotal to form the total riser, add a tilde (~) to the label to identify the additional (other) value. Example:
A
B
C
D
Subtotal^
Other~
50
10
-10
5
SUM(A:D)
2
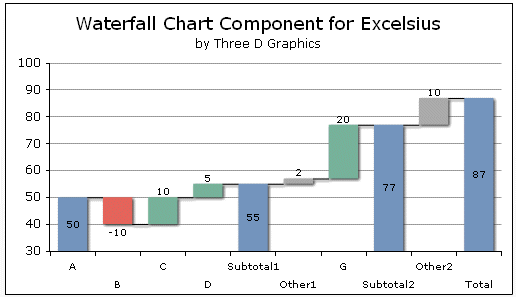
Multiple Subtotal and Other risers may be defined in a data set to appear at any location in the chart. The carat (^) identifies a value to be interpreted as a subtotal (drawn from the baseline). The tilde (~) identifies a value to be interpreted as an Other riser (not color coded red/green). Example:
A
B
C
D
Subtotal1^
Other1~
G
Subtotal2^
Other2~
50
10
-10
5
SUM(A:D)
2
20
SUM (E:G)
10
Use Custom Total Value: The TOTAL riser is auto-calculated based on the specified range of values in the Data Values field. This field lets you override that calculation and define the value of the TOTAL riser. Click this checkbox and enter a custom total value or click the data button to choose a value from a cell in the spreadsheet.
Three D Graphics |