The following tables lists each of the possible graph types that can be selected using the GraphType property:
GraphType Value
GraphType
0
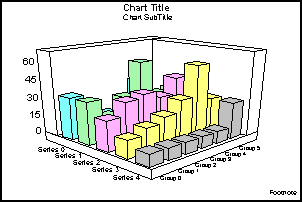
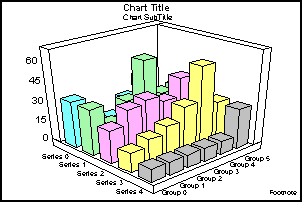
3D Bars
1
3D Pyramids
2
3D Octagons
3
3D Cylinder
4
3D Floating Cubes
5
3D Floating Pyramids
6
3D Connected Series Area
7
3D Connected Series Ribbon
8
3D Cone
9
3D Connected Group Area
10
3D Connected Group Ribbon
11
3D Sphere
12
3D Surface
13
3D Surface with Sides
14
3D Honeycomb Surface
15
3D Smooth Surface
16
3D Smooth Surface with Sides
17
Vertical Clustered Bars
18
Vertical Stacked Bars
19
Vertical Dual-Axis Clustered Bars
20
Vertical Dual-Axis Stacked Bars
21
Vertical Bi-Polar Clustered Bars
22
Vertical Bi-Polar Stacked Bars
23
Vertical Percent Bars
24
Horizontal Clustered Bars
25
Horizontal Stacked Bars
26
Horizontal Dual-Axis Clustered Bars
27
Horizontal Dual-Axis Stacked Bars
28
Horizontal Bi-Polar Clustered Bars
29
Horizontal Bi-Polar Stacked Bars
30
Horizontal Percent Bars
31
Vertical Absolute Area
32
Vertical Stacked Area
33
Vertical Bi-Polar Absolute Area
34
Vertical Bi-Polar Stacked Area
35
Vertical Percent Area
36
Horizontal Absolute Area
37
Horizontal Stacked Area
38
Horizontal Bi-Polar Absolute Area
39
Horizontal Bi-Polar Stacked Area
40
Horizontal Percent Area
41
Vertical Absolute Line
42
Vertical Stacked Line
43
Vertical Dual-Axis Absolute Line
44
Vertical Dual-Axis Stacked Line
45
Vertical Bi-Polar Absolute Line
46
Vertical Bi-Polar Stacked Line
47
Vertical Percent Line
48
Horizontal Absolute Line
49
Horizontal Stacked Line
50
Horizontal Dual-Axis Absolute Line
51
Horizontal Dual-Axis Stacked Line
52
Horizontal Bi-Polar Absolute Line
53
Horizontal Bi-Polar Stacked Line
54
Horizontal Percent Line
55
Pie
56
Ring Pie
57
Multi Pie
58
Multi Ring Pie
59
Multi Proportional Pie
60
Multi Proportional Ring Pie
61
XY Scatter
62
XY Scatter Dual-Axis
63
XY Scatter with Labels
64
XY Scatter with Labels Dual-Axis
65
Polar
66
Polar Dual-Axis
67
Radar Line
68
Radar Area
69
Radar Line Dual-Axis
70
Open-Hi-Lo-Close Candle Stock Chart
71
Open-Hi-Lo-Close Candle Stock Chart with Volume
72
Candle Stock Hi-Lo Open-Close
73
Stock Hi-Lo
74
Stock Hi-Lo Dual-Axis
75
Stock Hi-Lo Bi-Polar
76
Stock Hi-Lo Close
77
Stock Hi-Lo Close Dual-Axis
78
Stock Hi-Lo Bi-Polar
79
Stock Hi-Lo Open-Close
80
Stock Hi-Lo Open-Close Dual-Axis
81
Stock Hi-Lo Open-Close Bi-Polar
82
Stock Hi-Lo with Volume
83
Stock Hi-Lo Open-Close with Volume
84
Candle Stock Hi-Lo Open-Close with Volume
85
Vertical Histogram
86
Horizontal Histogram
87
Spectral Map
88
Stock Hi-Lo Close with Volume
89
Bubble Chart
90
Bubble Chart with Labels
91
Bubble Chart Dual-Axes
92
Bubble Chart with Labels Dual-Axes
93
Pie-Bar Chart
94
Ring Pie-Bar Chart
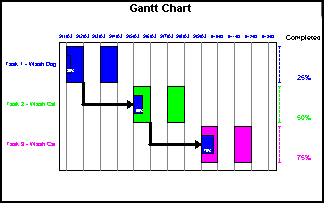
99
Gantt Chart
100
Vertical Waterfall Chart
101
Horizontal Waterfall Chart
102
Pareto Chart
103
Multi-Y Y1/Y2/Y3-Axes Chart
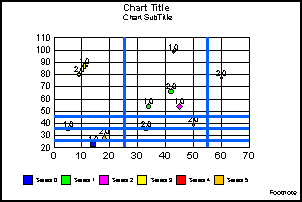
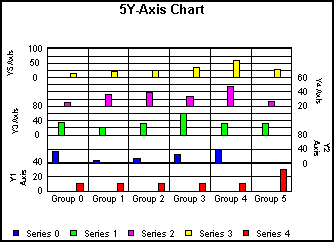
104
Multi-Y Y1/Y2/Y3/Y4-Axes Chart
105
Multi-Y Y1/Y2/Y3/Y4/Y5-Axes Chart
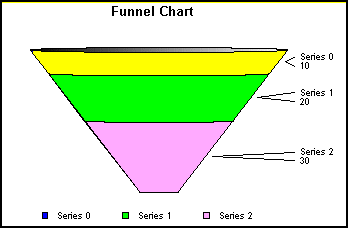
106
Funnel Chart
110
Gauge Chart
116
3D Smooth Connected Groups
117
3D Smooth Connected Series
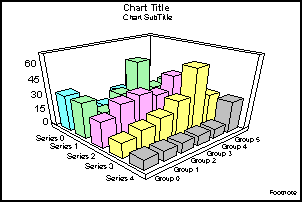
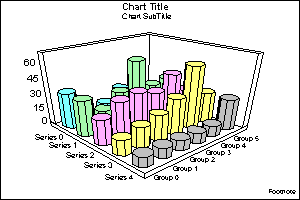
3D Bars: Standard 3D chart. Displays a bar for each value in the data set.
3D Pyramid: Pyramids are a good type for showing volume information, like an amount of some item.
3D Octagon: Octagons drawn in 3D. Can be made elliptical or more perfectly columnar.
3D Cylinder:
3D Floating Cubes: Excellent 3D type for data values that are close to each other. You can see under and around the cubes.
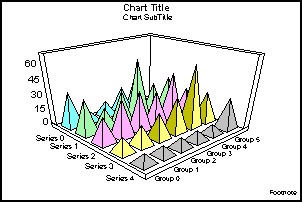
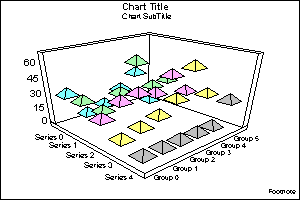
3D Floating Pyramids: Diamond-like pyramids floating in air trace out data points.
3D Connected Series Area: Good for showing trend information along the series dimension.
3D Connected Series Ribbon: Good for showing trend information along the series dimension.
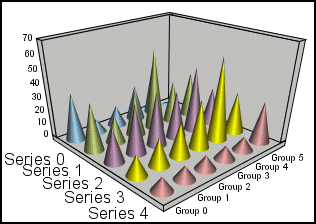
3D Cone:
3D Connected Group Area: Good for showing trend information along the groups dimension.
3D Connected Group Ribbon: Good for showing trend information along the groups dimension.
3D Sphere:
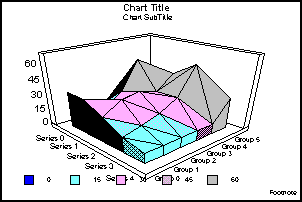
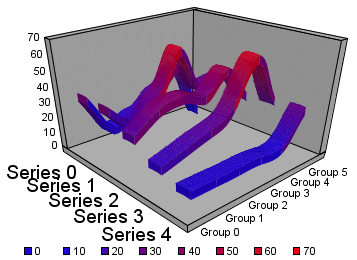
3D Surface: Graphs all data points as a 3D surface, like a rolling wave.
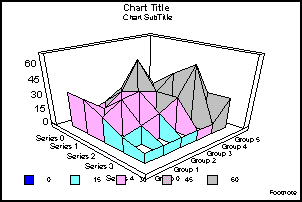
3D Surface with Sides: Graph all data points as a 3D surface, with solid sides.
3D Honeycomb Surface: Graphs all data points as a 3D surface using a "honeycomb" effect.
3D Smooth Surface:
3D Smooth Surface with Sides:
3D Smooth Connected Groups:
3D Smooth Connected Groups:
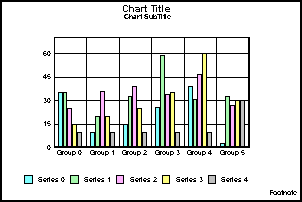
The following illustrations show the vertical bar graphs. All of the illustrations were done without 2.5D depth applied (i.e., DepthRadius = 0).
Vertical Clustered Bars: Side by side groups of bars. The standard type of two-dimensional bar chart.
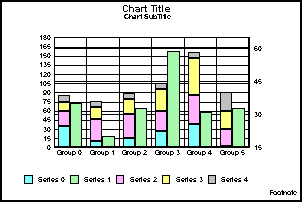
Vertical Stacked Bars: Stacked groups of bars. Each stack is comprised of all series in this group, added up to get a total. The axis is the total value of the cumulative points.
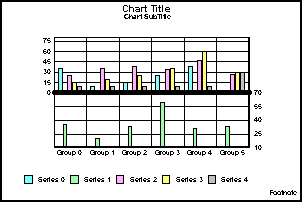
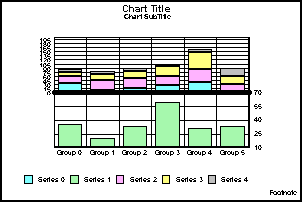
Vertical Dual-Axis Clustered Bars: Also called a Dual-Y chart. Any series can be assigned to either of the two axis.
Vertical Dual-Axis Stacked Bars: Also called a Dual-Y stacked chart. Separate stacks will be created for the data on each of the two axis.
Vertical Bi-Polar Clustered Bars: A Dual-Y chart with the two axis physically split into separate sections, so that each can be seen independently of the other.
Vertical Bi-Polar Stacked Bars: A Stacked Dual-Y chart with the two axis physically split into separate sections, so that each can be seen independently of the other.
Vertical Percent Bars: A bar version of a pie chart. Each group calculates the percent of the total required for each series. The axis goes from 0 to 100%.
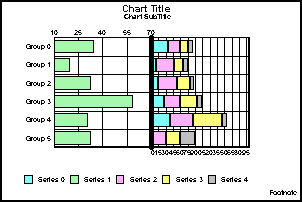
The following illustrations show the horizontal bar graphs. All of the illustrations were done without 2.5D depth applied (i.e., DepthRadius = 0).
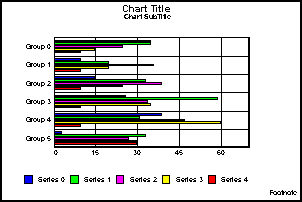
Horizontal Clustered Bars: Side by side groups of bars. The standard type of two-dimensional bar chart.
Horizontal Stacked Bars: Stacked groups of bars. Each stack is comprised of all series in this group, added up to get a total. The axis is the total value of the cumulative points.
Horizontal Dual-Axis Clustered Bars: Also called a Dual-Y chart. Any series can be assigned to either of the two axis.
Horizontal Dual-Axis Stacked Bars: Also called a Dual-Y stacked chart. Separate stacks will be created for the data on each of the two axis.
Horizontal Bi-Polar Clustered Bars: A Dual-Y chart with the two axis physically split into separate sections, so that each can be seen independently of the other.
Horizontal Bi-Polar Stacked Bars: A Stacked Dual-Y chart with the two axis physically split into separate sections, so that each can be seen independently of the other.
Horizontal Percent Bars: A bar version of a pie chart. Each group calculates the percent of the total required for each series. The axis goes from 0 to 100%.
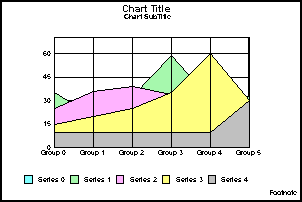
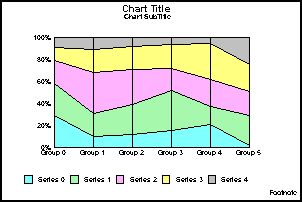
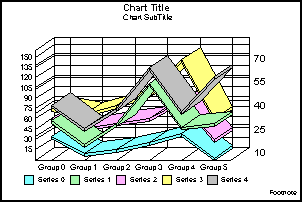
The following illustrations show the vertical area graphs. All of the illustrations were done without 2.5D depth applied (i.e., DepthRadius = 0).
Vertical Absolute Area: Areas draw on top of each other to show the absolute relationships between data series. Use when some data "pokes up" behind other.
Vertical Stacked Area: Areas stack on top of each other. The axis is the cumulative total of all the groups.
Vertical Bi-Polar Absolute Area: A Dual-Y chart with the two axis physically split into separate sections, so that each can be seen independently of the other.
Vertical Bi-Polar Stacked Area: A Stacked Dual-Y chart with the two axis physically split into separate sections, so that each can be seen independently of the other.
Vertical Percent Area: An area version of a pie chart. Each group calculates the percent of the total required for each series. The axis goes from 0 to 100%.
The following illustrations show the horizontal area graphs. All of the illustrations were done without 2.5D depth applied (i.e., DepthRadius = 0).
Horizontal Absolute Area: Areas draw on top of each other to show the absolute relationships between data series. Use when some data "pokes up" behind other.
Horizontal Stacked Area: Areas stack on top of each other. The axis is the cumulative total of all the groups.
Horizontal Bi-Polar Absolute Area: A Dual-Y chart with the two axis physically split into separate sections, so that each can be seen independently of the other.
Horizontal Bi-Polar Stacked Area: A Stacked Dual-Y chart with the two axis physically split into separate sections, so that each can be seen independently of the other.
Horizontal Percent Area: An area version of a pie chart. Each group calculates the percent of the total required for each series. The axis goes from 0 to 100%.
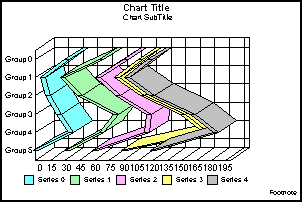
Vertical Absolute Line: Lines draw on top and under each other to show the absolute relationships between data series.
Vertical Stacked Line: Lines stack on top of each other. The axis is the cumulative total of all the groups.
Vertical Dual-Axis Absolute Line: Also called a Dual-Y line chart. Any series can be assigned to either of the two axis.
Vertical Dual-Axis Stacked Line: Also called a Dual-Y stacked line chart. Separate stacks will be created for the data on each of the two axis.
Vertical Bi-Polar Absolute Line: A Dual-Y chart with the two axis physically split into separate sections, so that each can be seen independently of the other.
Vertical Bi-Polar Stacked Line: A Stacked Dual-Y chart with the two axis physically split into separate sections, so that each can be seen independently of the other.
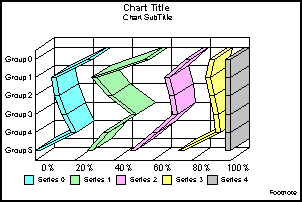
Vertical Percent Line: A line version of a pie chart. Each group calculates the percent of the total required for each series. The axis goes from 0 to 100%.
Horizontal Absolute Line: Lines draw on top and under each other to show the absolute relationships between data series.
Horizontal Stacked Line: Lines stack on top of each other. The axis is the cumulative total of all the groups.
Horizontal Dual-Axis Absolute Line: Also called a Dual-Y line chart. Any series can be assigned to either of the two axis.
Horizontal Dual-Axis Stacked Line: Also called a Dual-Y stacked line chart. Separate stacks will be created for the data on each of the two axis.
Horizontal Bi-Polar Absolute Line: A Dual-Y chart with the two axis physically split into separate sections, so that each can be seen independently of the other.
Horizontal Bi-Polar Stacked Line: A Stacked Dual-Y chart with the two axis physically split into separate sections, so that each can be seen independently of the other.
Horizontal Percent Line: A line version of a pie chart. Each group calculates the percent of the total required for each series. The axis goes from 0 to 100%.
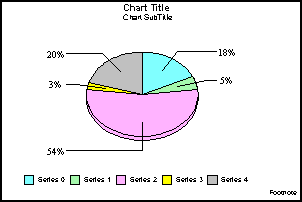
Pie: The most widely used chart for displaying percentages of a total.
Ring Pie: A ring variant of a pie chart. The total of all slices is placed in the center. Very popular in Asian countries.
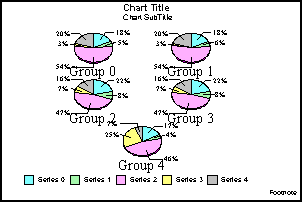
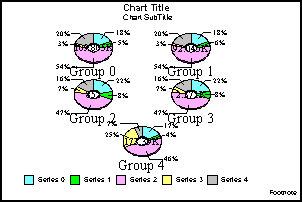
Multi Pie: A separate pie is drawn for each group in the data set. A pie variation on Percent Bars.
Multi Ring Pie: A separate ring pie is drawn for each group in the data set.
Multi Proportional Pie: Each pie is sized in proportion to its total across the entire data set.
Multi Proportional Ring Pie: Each ring pie is sized in proportion to its total across the entire data set.
The following illustrations show the scatter charts. All of the illustrations were done MarkerSizeDefault set to 90 and UseSeriesShapes set to True.
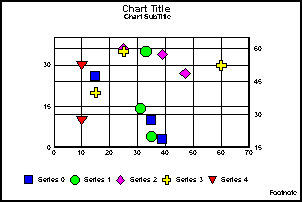
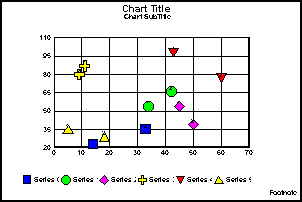
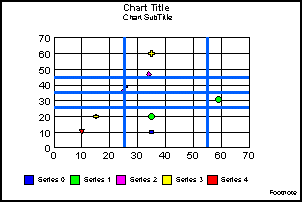
XY Scatter: TWO values per marker, X and Y, in that order. A standard X-Y plot.
XY Scatter Dual-Axis: Dual-Y scatter chart. TWO values per marker, X and Y, in that order.
XY Scatter with Labels: THREE values per maker, X, Y and text label, in that order. Each XY point is discreetly labeled.
XY Scatter with Labels Dual-Axis: A Dual-Y scatter chart with labeled markers. Requires THREE values per marker, X, Y, and text label, in that order.
XY Polar: A polar coordinate scatter chart. Requires TWO values per marker in the following order: X (degree) and Y (distance from the center).
XY Polar Dual-Axis: A Dual-Y polar coordinate scatter chart. Requires TWO values per marker in the following order: X (degree) and Y (distance from the center).
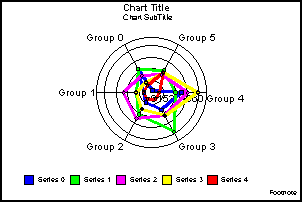
Radar Line: A circular line chart. Excellent for cyclical data, such as hourly or monthly figures.
Radar Area: A circular area chart. Excellent for comparisons or cyclical data sets.
Radar Line Dual-Axis: A Dual-Y variation on Radar Line. Excellent for two sets of cyclical data.
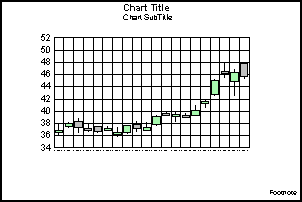
Open-Hi-Lo-Close Candle Stock Chart: Requires FOUR values per marker: Open, High, Low, and Close, in that order.
Open-Hi-Lo-Close Candle Stock Chart with Volume: Requires FIVE values per marker: Open, High, Low, Close and Volume.
Candle Stock Open-Close: Requires TWO values per marker: Open and Close. A "Candle" financial equity chart.
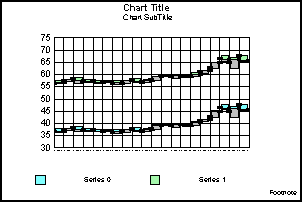
Stock Hi-Lo: Requires TWO values per maker: High and Low, in that order. A standard financial equity chart.
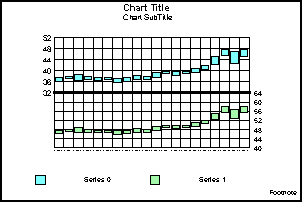
Stock Hi-Lo Dual-Axis: Dual-Y HiLo chart. Requires TWO values per marker: High and Low.
Stock Hi-Lo Bi-Polar: Dual-Y chart with axis split into separate sections. Requires TWO values per marker: High and Low.
Stock Hi-Lo Close: Requires THREE values per marker: High, Low and Close, in that order. A standard financial equity chart.
Stock Hi-Lo Close Dual-Axis: Dual-Y version of Hi-Lo Close chart. Requires THREE values per marker: High, Low, and Close.
Stock Hi-Lo Close Bi-Polar: Dual-Y chart with axis split into separate sections. Requires THREE values per marker: High, Low, and Close.
Stock Hi-Lo Open-Close: Requires FOUR values per marker: Open, High, Low, and Close. A standard financial equity chart.
Stock Hi-Lo Open-Close Dual-Axis: Dual-Y version of GraphType 79. Requires FOUR values per marker: Open, High, Low, and Close.
Stock Hi-Lo Open-Close Bi-Polar: Dual-Y chart with two axis split into separate sections. Requires FOUR values per marker: Open, High, Low, and Close.
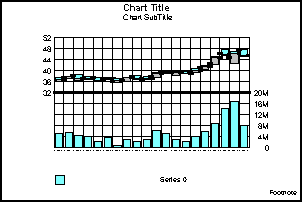
Stock Hi-Lo with Volume: Display stock performance along with volume. Requires THREE values per marker: High, Low and Volume.
Stock Hi-Lo Open-Close with Volume: Display stock performance along with volume. Requires FIVE values per marker: Open, High, Low, Close, and Volume.
Candle Stock Open-Close with Volume: Display "Candle" stock performance along with volume. Requires THREE values per marker: Open, Close, and Volume.
Stock Hi-Lo Close with Volume: Display stock performance along with volume. Requires FOUR values per marker: High, Low, Close, and Volume.
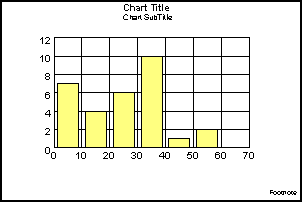
Vertical Histogram: Standard histogram. Groups all of the data together and assigns it to "buckets" based on value. There are no series or groups in this chart type.
Horizontal Histogram: Groups all of the data together and assigns it to "buckets" based on value. There are no series or groups in this chart type.
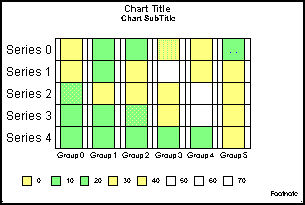
Spectral Map: Row or column matrix of markers that are colored according to data values.
Bubble Chart: Three values per marker -- X, Y, and Z, in that order. An X-Y plot where marker size depends on Z.
Bubble Chart with Labels: Four values per marker -- X, Y, Z, and text label, in that order. An X-Y plot where marker size depends on Z, with labels.
Bubble Chart Dual-Axis: Three values per marker -- X, Y, and Z, in that order. An X-Y plot where marker size depends on Z.
Bubble Chart with Labels Dual-Axis: Four values per marker -- X, Y, Z, and text label, in that order. An X-Y plot where marker size depends on Z, with labels.
Pie-Bar Chart:
Ring Pie-Bar Chart:
Gantt Chart: Provides a clear and simple expression of the initially scheduled start and completion dates of the events that contribute to a project.
Vertical Waterfall Chart:
Horizontal Waterfall Chart:
Pareto Chart:
Multi-Y Y1/Y2/Y3-Axes Chart: Vertical bar chart with 3 Y-axes.
Multi-Y Y1/Y2/Y3/Y4-Axes Chart: Vertical bar chart with 4 Y-axes.
Multi-Y Y1/Y2/Y3/Y4/Y5-Axes Chart: Vertical bar chart with 5 Y-axes.
Funnel Chart: A pie chart that draws only one group of data at a time.
Gauge Chart: A chart that shows the value of a single data point.
The Viewing3DAnglePreset property selects an entry in a table of "preset" viewing angles for 3D graphs. It can be set to one of the following:
Viewing3DAnglePreset Value
Description
-1 =
Custom (as set by CubeViewerX/Y/Z, CubeWallThickX/Y/Z, etc.)
0=
Standard
1=
View Along Groups
2=
View Along Series
3=
Distorted
4=
Isometric Standard
5=
Distorted Standard
6=
Group Emphasis
7=
Blast-O-Vision
8=
Thin Wall Standard
9=
Isometric View Along Groups
10=
Isometric View Along Groups #2
11=
High Backed Standard
12=
Upwardly Distorted
13=
Downtilt Standard
14=
Narrow Isometric
15=
Isometric View Along Groups