For all chart types except histogram and
tagcloud,
this property defines the chart's group labels that will appear on the ordinal axis.
For a tagcloud chart, this property defines the labels that appear in the chart according to the data values.
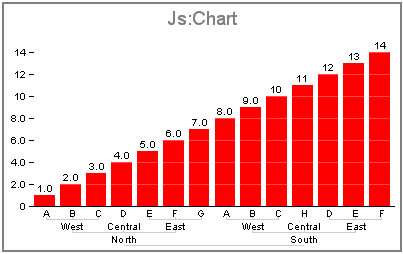
For all chart types except tagcloud, group labels can be defined as a string, an array of strings, or as a JSON object to
produce nested labels. To define nested group labels, simply provide group labels in a hierarchical format and the nested
labels will be automatically used. The chart frame will be automatically adjusted to leave the proper space for the axis.
Nested labels are implemented only for left and bottom axis. The nodes are nested in the JSON structure with the leaves stored in an
array. For a tagcloud chart, group labels must be defined as an array of strings.
groupLabels: 'string' | ['string'...'string'] | JSON Object
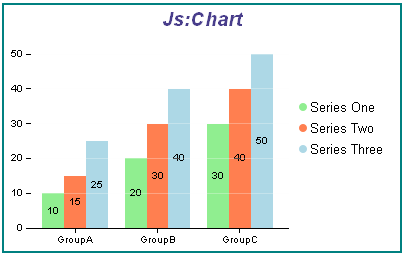
legend: {visible: true},
blaProperties: {orientation: 'vertical'},
groupLabels: "GroupA GroupB GroupC",
series: [
	{series: 0, label: 'Series One', color: 'lightgreen'},
	{series: 1, label: 'Series Two', color: 'coral'},
	{series: 2, label: 'Series Three', color: 'lightblue'},
	{series: 3, label: 'Series Four', color: 'burlywood'},
]
legend: {visible: true},
blaProperties: {orientation: 'vertical'},
groupLabels: ['Group A', 'Group B', 'Group C'],
series: [
	{series: 0, label: 'Series One', color: 'lightgreen'},
	{series: 1, label: 'Series Two', color: 'coral'},
	{series: 2, label: 'Series Three', color: 'lightblue'},
	{series: 3, label: 'Series Four', color: 'burlywood'},
	]
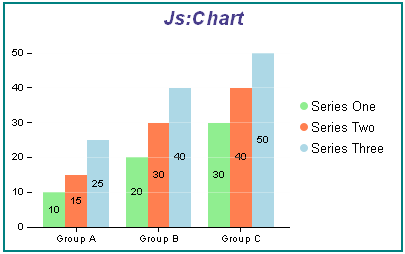
chart.groupLabels = {
   Europe: {
    North: {
      West: [ "A", "B", "C" ],
      Central: [ "D" ],
      East: [ "E", "F", "G" ]
    },
    South: {
      West: [ "A", "B", "C" ],
      Central: [ "H" ],
      East: [ "D", "E", "F" ],
    }
   }
 };
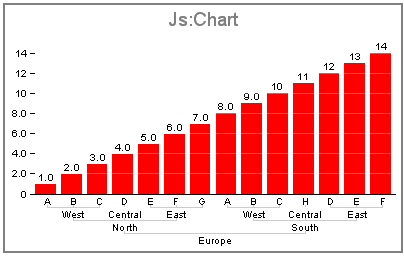
chart.groupLabels = {
    North: {
      West: [ "A", "B", "C" ],
      Central: [ "D" ],
      East: [ "E", "F", "G" ]
    },
    South: {
      West: [ "A", "B", "C" ],
      Central: [ "H" ],
      East: [ "D", "E", "F" ],
    }
};