chartType: a string that defines the chart type. The default value is 'bar'. It can be one of the following.
 |
 |
 |
 |
 |
 |
 |
 |
 |
 |
 |
 |
 |
 |
 |
 |
 |
 |
 |
 |
 |
 |
 |
 |
 |
 |
 |
 |
This property defines the chart type.
chartType: 'string'
chartType: a string that defines the chart type. The default value is 'bar'. It can be one of the following.
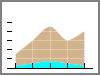
data: [[10, 100, 15, 120, 25],[15, 115, 25, 85, 35],[120, 20, 95, 22, 33],[125, 25, 45, 22, 33]],
chartType: 'area',
legend: {visible: true},
blaProperties: {orientation: 'vertical', seriesLayout: 'stacked',lineConnection: 'curved'},
series: [
	{series: 0, color: 'lightgreen'},
	{series: 1, color: 'coral'},
	{series: 2, color: 'lightblue'},
	{series: 3, color: 'burlywood'},
],
groupLabels: ['Group A', 'Group B', 'Group C', 'Group D', 'Group E'],
Notes:
- Use blaProperties to define the general layout of the chart.
data: [[70,80,90],[40,50,60],[10,20,30]],
chartFrame: { fill: { color: 'hsla(240, 100%, 50%, 0.1)' }, border: {width: 1, color: 'black'} },
chartType: 'area3d',
threedProperties: {
	rotate: 30,
	tilt: 30,
	shadeSides: true
},
legend: {visible: true, position: 'bottom'},
series: [
	{series: 0, color: 'cyan'},
	{series: 1, color: 'bisque'},
	{series: 2, color: 'lightblue'},
]
Notes:
- Use threedProperties to define the general layout of the chart.
data: [[10, 100],[15, 115],[120, 20],[125, 25]],
chartType: 'bar',
legend: {visible: true},
blaProperties: {orientation: 'vertical'},
series: [
	{series: 0, color: 'lightgreen'},
	{series: 1, color: 'coral'},
	{series: 2, color: 'lightblue'},
	{series: 3, color: 'burlywood'},
],
groupLabels: ['Group A', 'Group B']
Notes:
- Use blaProperties to define the general layout of the chart.
data: [[70,80,90],[40,50,60],[10,20,30]],
chartFrame: { fill: { color: 'hsla(240, 100%, 50%, 0.1)' }, border: {width: 1, color: 'black'} },
chartType: 'bar3d',
threedProperties: {
	rotate: 30,
	tilt: 30,
	shadeSides: true
},
legend: {visible: true, position: 'bottom'},
series: [
	{series: 0, color: 'cyan'},
	{series: 1, color: 'bisque'},
	{series: 2, color: 'lightblue'},
]
Notes:
- Use threedProperties to define the general layout of the chart.
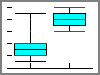
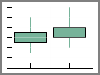
data = [[ [1,2,3,4,5],[6,7,8,9,10],[11,12,13,14,15] ]];
chartType: 'boxplot',
blaProperties: {orientation: 'vertical'},
series: [
{series: 0, color: 'lightblue', border: {width: 1}},
]
Notes:
- Each series and group in a box plot requires one array of five values. For example to define 1 series with 3 groups (3 boxes), you need an array of arrays of arrays such as: data = [[[1,2,3,4,5],[2,3,4,5,6],[3,4,5,6,7]]]. For a given series and group box, the first value is the minimum (lower 'hat'), the second defines the box bottom, the third value is median line, the fourth value defines the box top, and the fifth value defines the location of the top hat. Values must be in ascending order.
- Use boxPlotProperties to define the general appearance of a box plot.
- Use blaProperties.orientation to draw a horizontal or vertical chart.
- Box plot fill color and border are defined by the series color and border.
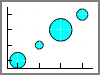
A bubble chart requires three values: [(X-Position, Y-Position, Size] to draw each bubble marker. A negative size value is treated as positive (i.e., the absolute value of the data). A null, undefined, or zero size will eliminate the marker. Sizes are proportional according to the range of size values in the data set. For example, a data set with values such as [[1,1,10], [2,2,20], [3,3,30]] would draw each marker comparatively larger. Disparate marker size values such as [[1,1,10], [2,2,2000]] will draw a large marker that exceeds the draw area. The series.marker.size property defines the size of the *smallest* marker. All other markers are scaled up from that smallest marker. Markers are scaled such that the *area* of the marker is proportional to its data value.
data: [[[10, 10, 10]],[[20,20,20]],[[30,30,30]],[[35,10,100]]],
chartType: 'bubble',
xaxis: {max: 40, title: {visible: true}},
yaxis: {max: 40, title: {visible: true}}
X/Y position values can be a number or a string.
data: [[['-A-', '-A-', 10]],[['-B-','-B-',20]],[['-C-','-C-',30]],[['-D-','-D-',100]]],
chartType: 'bubble',
xaxis: {title: {visible: true}},
yaxis: {title: {visible: true}}
The size value can be replaced by an array of values that define slices in pie markers. Each marker must be defined by: [X-position, Y-position, [slice1, slice2, ...slicen]]. The size of the marker is calculated from the slice values.
data: [[
//     x     y     pie slices
    [   1,  2,     [1,2,4]],  // pie 0
    [ 2.5,  6.25,  [4,3,4]],  // pie 1
    [3.75,  3.5,   [6,11,9]]  // pie 2
]],
chartType: 'bubble',
When this data format is used to define a bubble chart, set series: 'all', marker: {shape: 'pie'} to create the pie markers.
series: [
	{series: 'all', marker: {shape: 'pie', size: 30}},
	{series: 0, color: 'red'},{series: 1, color: 'green'},{series: 2, color: 'blue'}
]
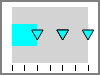
Bullet is a microchart that is a variation of the bar chart. It is designed to show a quantitative measure against qualitative ranges. For example, a quantitative measure such as profit or revenue could be visualized against quality (good, better, best) and related markers.
data: [[275, 250]],
height: 75,
chartType: 'bullet',
title: {text: 'Revenue'},
subtitle: {visible: true, font: '8pt Sans-Serif', text: 'US$ in thousands'},
yaxis: {
	min: 0,
	max: 300,
	colorBands: [
		{start: 0,stop: 150,color: 'silver'},
		{start: 150,stop: 225,color: 'lightgrey'},
		{start: 225,stop: 300,color: 'whitesmoke'},
		],
},
series: [
	{series: 0, group: 0, color: 'steelblue'},
	{series: 0, group: 1, color: 'white',marker: {size: 14, shape: 'triangle',border: {width: 1, color: 'black'}}},
]
Notes:
- blaProperties.orientation draws the chart in horizontal/vertical format.
- yaxis properties control scaling (min/max), color bands, tick marks, labels, etc.
- series-specific properties control the color of the riser and color and shape of markers.
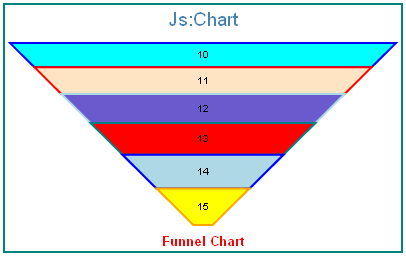
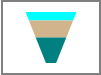
data: [[10,11,12,13,14,15]],
chartType: 'funnel',
funnelProperties: {
	topWidth: '100%',
	baseWidth: '5%',
	groupLabel: {
		visible: true,
		font: 'bold 10pt Sans-Serif',
		color: 'red'
	}
},
groupLabels: ["Funnel Chart"],
series: [
	{series: 0, color: 'cyan',  border: {width: 2, color: 'blue'}},
	{series: 1, color: 'bisque',  border: {width: 2, color: 'red'}},
	{series: 2, color: 'slateblue',  border: {width: 2, color: 'lightblue'}},
	{series: 3, color: 'red',  border: {width: 2, color: 'teal'}},
	{series: 4, color: 'lightblue',  border: {width: 2, color: 'blue'}},
	{series: 5, color: 'yellow',  border: {width: 2, color: 'orange'}},
]
Notes:
- A funnel chart is basically a pie chart that shows only one group of data at a time. The series in the group are stacked in the funnel with the first series at the top and the last series at the bottom.
- Use funnelProperties to define the general layout of a funnel chart
- series-specific properties control the color of funnel segments.
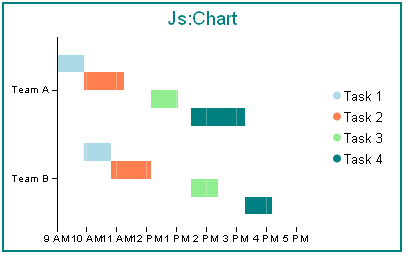
data: [
	[["9A", "10A", 0], ["10A" , "11:30", 1], ["12:30", "1:30P", 2], ["2P", "4P", 3]],
	[["10A", "11A", 0], ["11:00" , "12:30", 1], ["2P", "3P", 2], ["4P", "5P", 3]]
],
chartType: 'gantt',
legend: {visible: true},
ganttProperties: {
	startTime: '9A',
	stopTime: '5P',
	interval: 'hours',
	labelFormat: 'h tt',
	},
groupLabels: ["Team A","Team B"],
series: [
	{series: 0, color: 'lightblue', label: 'Task 1'},
	{series: 1, color: 'coral', label: 'Task 2'},
	{series: 2, color: 'lightgreen', label: 'Task 3'},
	{series: 3, color: 'teal', label: 'Task 4'},
],
Notes:
- Gantt charts require either two or three values for each riser. The first value is always a start time. The second value is a stop time (if ganttProperties.durationValues=false) or a duration (if ganttProperties.durationValues=true). The optional third value defines the series each riser belongs to.
- To define and format time values on the Y-axis, the first and second values must be formatted as time strings as shown in this example.
- Use ganttProperties to define the general appearance of a gantt chart.
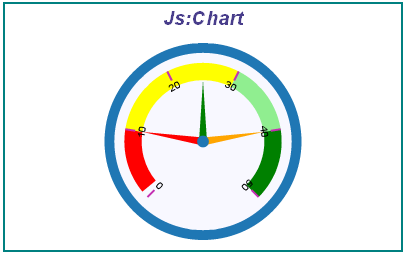
data: [[10],[25],[40]],
chartType: 'gauge',
gaugeProperties: {
	fill: {color: 'ghostwhite',},
	axisTickLength: 10
},
yaxis: {
	min: 0,
	max: 50,
	colorBands: [
		{start: 1,stop: 10,color: 'red'},
		{start: 10,stop: 30,color: 'yellow'},
		{start: 30,stop: 40,color: 'lightgreen'},
		{start: 40,stop: 50,color: 'green'},
	],
	majorGrid: {
		lineStyle: {width: 2,color: 'rgb(196,48,178)'},
	}
},
Notes:
- For a Gauge Chart, use gaugeProperties to define the general layout of the gauge.
- The numeric yaxis properties control scaling, tick marks, and colors assigned to segments of the gauge axis.
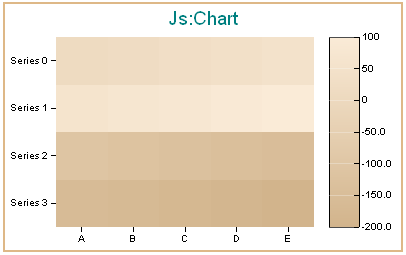
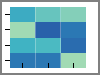
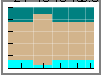
data: [
[10,20,30,40,50],[60,70,80,90,100],
[-110,-120,-130,-140,-150],[-160,-170,-180,-190,-200]
],
chartType: 'heatmap',
yaxis: {colorScale: {colors: ['tan', 'antiquewhite'] }},
legend: {visible: true},
Notes:
- Heatmaps expect the same kind of data as Bar/Line/Area charts (an array of arrays).
- Each internal array forms a row in the heatmap table.
- Series labels are plotted on the left edge of the chart. Use zaxis.labels properties to format these labels.
- Group labels are plotted on the bottom edge of the chart. Use xaxis.labels properties to format these labels.
- yaxis.ColorScale controls the color of the cells in the heatmap table.
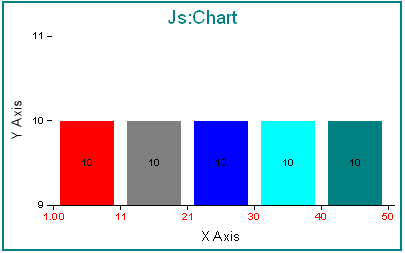
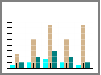
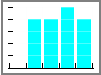
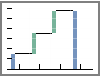
data = [[1,2,3,4,5,6,7,8,9,10,11,12,13,14,15,16,17,18,19,
	20,21,22,23,24,25,26,27,28,29,30,31,32,33,34,35,
	36,37,38,39,40,41,42,43,44,45,46,47,48,49,50]],
chartType: 'histogram',
blaProperties: {orientation: 'vertical'},
histogramProperties: {
	binCount: 5,
},
series: [
{series: 0, group: 0, color: 'red'},
{series: 0, group: 1, color: 'grey'},
{series: 0, group: 2, color: 'blue'},
{series: 0, group: 3, color: 'cyan'},
{series: 0, group: 4, color: 'teal'},
]
Notes:
- A histogram is a graphical representation that shows a visual impression of the distribution of data.
- Use histogramProperties to control the distribution of data.
- blaProperties.orientation draws the chart in horizontal/vertical format.
- In a vertical histogram, the Y-axis is on the left side of the chart and the X-axis is drawn on the bottom of the chart.
- In a horizontal histogram, the X-axis is on the left side of the chart and the Y-axis axis is drawn on the bottom of the chart.
- Use blaProperties.barGroupGapWidth to control the width of histogram risers.
- The series-specific properties control the colors and borders (if any) of histogram risers.
- Use yaxis properties to control the format of Y-axis title and labels.
- Use xaxis properties to control the format of X-axis title and labels. X-axis labels are calculated. They are not defined by the groupLabels property.
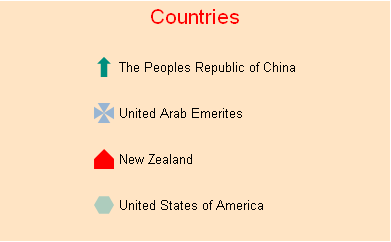
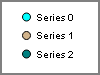
chartType: 'legend',
legend: {
	visible: true,
	markerSize: 20,
	backgroundcolor: 'bisque',
	title: {visible: true, text: 'Countries', font: '16pt Sans-Serif', color: 'red'}
	},
series: [
	{series: 0, color: 'rgb(0,142,126)', label: 'The Peoples Republic of China', marker: {shape: 'arrow'}},
	{series: 1, color: 'rgb(152,181,211)', label: 'United Arab Emerites', marker: {shape: 'pirateCross'}},
	{series: 2, color: 'red', label: 'New Zealand', marker: {shape: 'house'}},
	{series: 3, color: 'rgb(173,204,189)', label: 'United States of America', marker: {shape: 'hexagon'}}
]
Notes:
- This chart type draws a chart where the legend *is* the chart. Selecting this chart type will resize the legend to the chosen width and height. Legend.position controls the entries layout: 'bottom' gives a horizontal legend. Any other position draws a vertical legend chart. Horizontal aligns all entries on the left edge, evenly spaced vertically. Vertical aligns entries along the top edge, evenly spaced horizontally.
- Use legend properties to control the format of the legend chart.
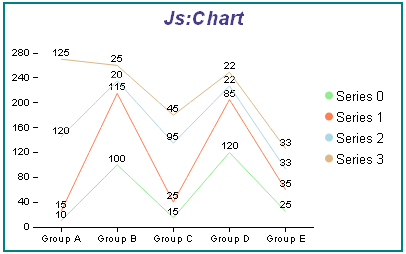
The data that defines a line riser in a line chart can be an array of single values (one for each series/group data point) or two values nested in arrays that define a data point and a marker size (e.g., [[1,2],[2,12],[1,4]], etc.).
The following example uses four arrays (one for each series) of single values to define the line chart.
var data = [[10, 100, 15, 120, 25],[15, 115, 25, 85, 35],[120, 20, 95, 22, 33],[125, 25, 45, 22, 33]];
chartType: 'line',
legend: {visible: true},
blaProperties: {orientation: 'vertical', seriesLayout: 'stacked'},
series: [
	{series: 0, color: 'lightgreen'},
	{series: 1, color: 'coral'},
	{series: 2, color: 'lightblue'},
	{series: 3, color: 'burlywood'},
],
groupLabels: ['Group A', 'Group B', 'Group C', 'Group D', 'Group E'],
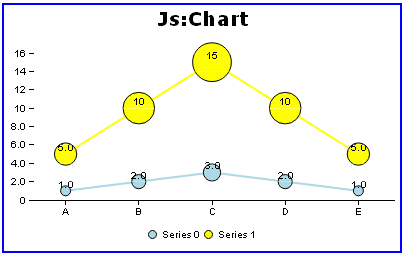
The following example uses two values nested in arrays that define a data point and a marker size.
data: [ [[1,2],[2,2],[3,3],[2,2],[1,1]] , [[5,5],[10,10],[15,15],[10,10],[5,5]] ],
chartType: 'line',
blaProperties: {orientation: 'vertical'},
series: [
	{series: 'all', marker: {visible: true}},
	{series: 0, color: 'lightblue'},
	{series: 1, color: 'yellow'}
	]
Notes:
- To use the marker size data format, set series: 'all', marker: {visible: true}. A negative marker size value is treated as positive (i.e., the absolute value of the data). A null, undefined, or zero marker size will eliminate the marker. Marker sizes are proportional according to the range of size values in the data set. For example, a data set with values such as [[1,10], [2,20], [3,30]] would draw each marker comparatively larger. Disparate marker size values such as [[1,10], [2,2000]] will draw a large marker that exceeds the draw area. The series.marker.size property defines the size of the *smallest* marker. All other markers are scaled up from that smallest marker. Also, markers are scaled such that the *area* of the marker is proportional to its data value.
- If marker sizes are not defined in the data set, use series:marker to control the visibility, size (in pixels), and format of markers at each data point.
- Use blaProperties to define the general layout of the chart.
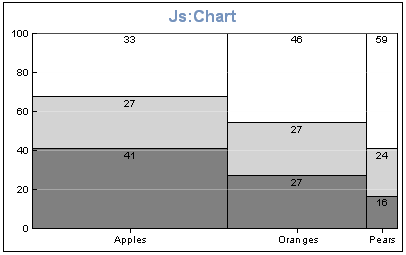
data: [98,46,6],[64,47,9],[79,79,22],
chartType: 'mekko',
blaProperties: {orientation: 'vertical'},
groupLabels: ["Apples","Oranges","Pears"],
series: [
{series: 0, color: 'grey',border: {width: 1, color: 'black'}},
{series: 1, color: 'lightgrey',border: {width: 1, color: 'black'}},
{series: 2, color: 'white',border: {width: 1, color: 'black'}},
]
Notes:
A mekko (also called marimekko) chart is a percent bar chart, except that the width of each bar riser is based on the stack's overall value. You can use any data set that works for a regular or stacked bar chart.
data: [[1,2,3,4],[-1,-2,-3,-4],[5,6,7,8],[-5,-6,-7,-8],[10,20,30,40],[-10,-20,-30,-40],[50,60,70,80],[-50,-60,-70,-80]],
border: {width: 2, color: 'navy'},
chartType: 'parabox',
title: {text: "click & drag along each axis to select (filter) the lines"},
groupLabels: ['Grp1','Grp2','Grp3','Grp4'],
Notes:
- Parallel coordinates is a popular method of visualizing high-dimensional data using dynamic queries. The parabox chart type is similar to a regular line chart, except that each group in the line chart has a unique and interactive numeric axis.
- Each colored line represents one series of data. Each vertical bar represents a numeric axis. You can click and drag along each of the axes to select (filter) the lines that pass through that part of the axis.
- You can add a filter to multiple axes, which lets you narrow down the data set to match certain criteria. A single click on one axis makes that axis 'active'.
- In the default configuration, the series lines are colored by interpolation, such that the lines passing through the top of the active axis are red and the bottom of the axis are blue.
- The groupLabels property defines the set of vertical axes and their labels.
- Chart data is an array of arrays, where each inner array becomes a single colored line (series) in the chart. Each inner array must have a value corresponding to each vertical axis (if it doesn't, the array is ignored).
- You can set the active axis programmatically using the paraboxProperties.activeGroup property.
- Js:Chart also supports *categorical* (ordinal) vertical axes. These are drawn with a bubble marker on the vertical axis. The size of the bubble corresponds to the number of lines passing through it. Whether an axis is numeric or categorical is defined by the *first* series of data. If a value in the first array is a number, that axis is numeric. If a value in the first array is a string, that axis is categorical. Categorical axes are sorted automatically such that the biggest bubble is on top and bubble size descends from there.
- These charts have 3 color modes: 'bySeries', 'byGroup', and 'byHeight'. The default byHeight color mode uses the colors defined in colorMode.colorList for the byHeight interpolation. The bySeries color mode treats each line as a unique series, and uses the colors defined in the series array (e.g., If you have 50 lines, you need to define 50 series with 50 colors). The byGroup color mode also uses the colors in the series array, but if either the *first* vertical axis, or the *active* vertical axis is *categorical*, then all lines passing through the first bubble on that axis are colored with the same series1 color; all lines passing through the second bubble are colored with the series 2 color, etc. If the first axis and the active axis are both numeric, then byGroup is ignored and the chart is drawn byHeight.
- The xaxis.labels property can be used to format the labels above each ordinal division.
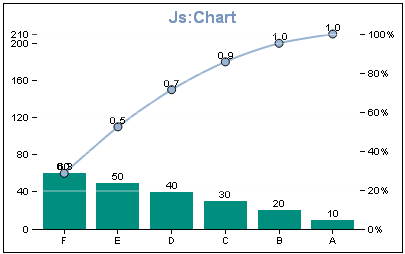
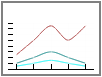
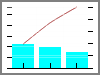
data: [[10,20,30,40,50,60]],
chartType: 'pareto',
blaProperties: {orientation: 'vertical',lineConnection: 'curved'},
series: [
{series: 0, color:'rgb(0,142,126)', marker: {visible: true}},
{series: 1, color:'rgb(152,181,211)', marker: {visible: true}},
],
Notes:
- A pareto chart is similar to a combo chart. The first series (series zero) draws as an absolute bar chart on the Y-axis. The second series (series one) draws as a cumulative percent line on the Y2-axis.
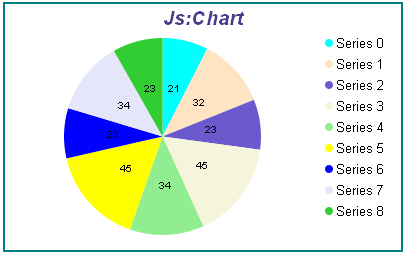
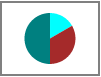
data: [[21],[32],[23],[45],[34],[45],[23],[34],[23]],
chartType: 'pie',
legend: {visible: true},
series: [
	{series: 0, color: 'cyan'},
	{series: 1, color: 'bisque'},
	{series: 2, color: 'slateblue'},
	{series: 3, color: 'beige'},
	{series: 4, color: 'lightgreen'},
	{series: 5, color: 'yellow'},
	{series: 6, color: 'blue'},
	{series: 7, color: 'lavender'},
	{series: 8, color: 'limegreen'},
]
Notes:
- Use pieProperties to define the general layout of the pie.
- Use the series-specific properties to color pie slices, show/hide data values, and explode/delete pie slices.
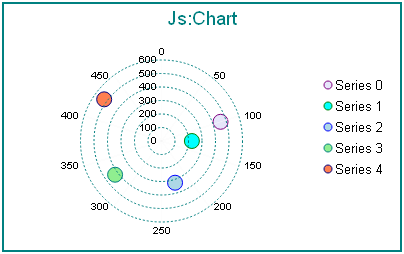
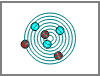
data: [
[[100,460]],[[125,225]],[[225,325]],[[325,425]],[[425,525]]
],
chartType: 'polar',
legend: {visible: true},
polarProperties: {
	straightGridLines: false,
	extrudeAxisLabels: false
},
yaxis: {
	majorGrid: {
	lineStyle: {width: 1,color: 'teal',dash: '2 2'},
	}
},
series: [
	{series: 0, color: 'lavender', marker:{size: 15, shape: 'circle', border: {width: 1, color: 'purple'}}},
	{series: 1, color: 'cyan', marker:{size: 15, shape: 'circle', border: {width: 1, color: 'green'}}},
	{series: 2, color: 'lightblue', marker:{size: 15, shape: 'circle', border: {width: 1, color: 'blue'}}},
	{series: 3, color: 'lightgreen', marker:{size: 15, shape: 'circle', border: {width: 1, color: 'teal'}}},
	{series: 4, color: 'coral', marker:{size: 15, shape: 'circle', border: {width: 1, color: 'navy'}}},
],
Notes:
- A polar chart is a circular scatter chart.
- Like scatter charts, a polar chart requires two values to draw each marker.
- polarProperties control the general appearance of a polar chart.
- yaxis properties control the circular grid around polar chart markers. These properties also control the appearance of axis labels and gridlines.
- xaxis properties control the appearance of labels and values on the X-axis (around the outside edge of the circular grid) and X-axis gridlines.
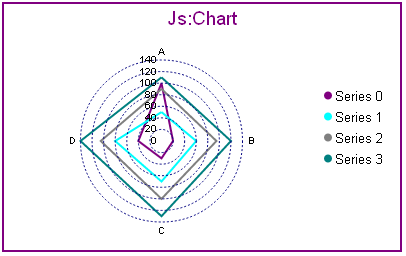
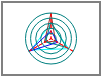
data: [[100,20,30,40],[50,60,70,80],[90,95,100,105],[110,120,130,140]],
chartType: 'radar',
legend: {visible: true},
yaxis: {
	majorGrid: {
		lineStyle: {width: 1,color: 'navy',dash: '2 2'},
		}
	},
series: [
	{series: 0, color: 'purple', border: {width: 2}},
	{series: 1, color: 'cyan', border: {width: 2}},
	{series: 2, color: 'grey', border: {width: 2}},
	{series: 3, color: 'teal', border: {width: 2}},
]
Notes:
- A radar chart is a circular line chart.
- Radar charts require one value for each line segment (and marker if shown).
- The yaxis.majorGrid property draws the circular grid around the risers.
- yaxis.labels properties control the appearance of labels and values inside the circular grid.
- Group axis (xaxis) labels draw around the outside edge of the circle.
- polarProperties can be used to create a radar area chart, extrude axis labels, and draw straight/circular grid lines.
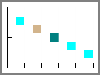
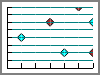
Scatter charts require two values (X-Position/Y-Position) to draw each marker.
data: [[[5, 9],[4, 13]],[[10,11],[12,13]],[[30,21],[22,23]],[[10,31],[32,33]]],
chartType: 'scatter',
legend: {visible: true},
series: [
	{series: 0, color: 'cyan', marker: {shape: 'triangle', size: 12, border: {width: 1, color:'blue'}}},
	{series: 1, color: 'bisque', marker: {shape: 'square', size: 13, border: {width: 1, color:'brown'}}},
	{series: 2, color: 'slateblue', marker: {shape: 'circle', size: 14, border: {width: 1, color:'blue'}}},
	{series: 3, color: 'beige', marker: {shape: 'diamond', size: 15, border: {width: 1, color:'brown'}}},
	{series: 4, color: 'lightgreen', marker: {shape: 'triangle', size: 16, border: {width: 1, color:'green'}}},
]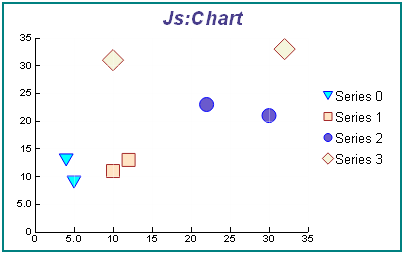
X/Y Position values can be a number or a string.
data: [[['-A-', '-A-']],[['-B-','-B-']],[['-C-','-C-']],[['-D-','-D-']]],
chartType: 'scatter',
xaxis: {title: {visible: true}},
yaxis: {title: {visible: true}}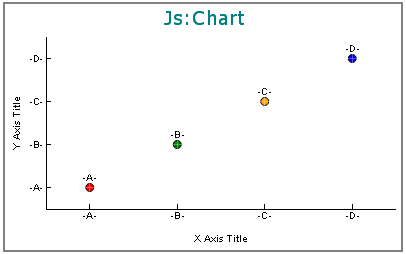
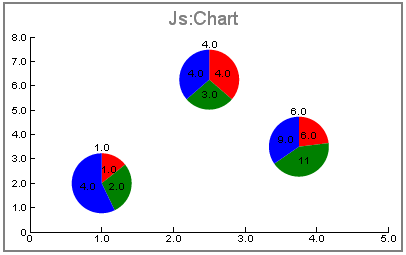
To use pie markers in a scatter chart, each marker must be defined by the X/Y-position and the values for each slice to draw in the pie marker. Example:
data: [
//     x     y     pie slices
    [   1,  2,     [1,2,4]],  // pie 0
    [ 2.5,  6.25,  [4,3,4]],  // pie 1
    [3.75,  3.5,   [6,11,9]]  // pie 2
],
chartType: 'scatter',
When this data format is used to define a scatter chart, set series: 'all', marker: {shape: 'pie'} to create the pie markers.
series: [
	{series: 'all', marker: {shape: 'pie', size: 60}},
	{series: 0, color: 'red'},{series: 1, color: 'green'},{series: 2, color: 'blue'}
]
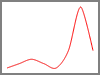
data: [[10,50,20,60]],
width: 50,
height: 20,
labelPadding: 10,
fill: {color: 'hsl(120, 75%, 75%)'},
border: {
	width: 2,
	color: 'green',
},
chartType: 'sparkline',
blaProperties: {orientation: 'vertical',lineConnection: 'curved'},
series: [
	{series: 0, color: 'red', border: {width:2}},
],
yaxis: {
	min: 10,
	max: 110,
},
Notes:
- Sparkline is a microchart that has no titles, labels, or legends. It is a single line chart that is intended to be drawn in a very small area (e.g., height: 20, width: 50). Only the first series of data is plotted.
- Use the series-specific properties for color / line formatting.
- Use the yaxis properties to control automatic or manual scale and min / max values.
- The chart:fill and chart:border properties can be used to format the chart frame. The chart:labelPadding property can be used to define the empty space between the chart border and the line.
- blaProperties.orientation draws the chart in horizontal or vertical format.
- blaProperties.lineConnection defines the line format as linear, curved, stepAfter, stepBefore, or stepBetween.
data: [
[[10,3,5,7],[12,4,6,8],[9,3,5,7],[19,13,15,17],[4,.2,3,1],[5,.1,2,1],[9,3,5,6],[11,2,4,6],[5,.1,2,1]]
],
chartType: 'stock',
blaProperties: {orientation: 'vertical'},
stockProperties: {
	startTime: '6A',
	stopTime: '2P',
	interval: 'hours',
	labelFormat: 'h tt'
	},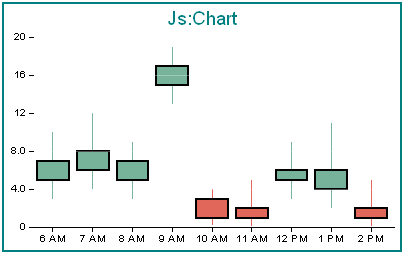
Notes:
- A high/low/open/close stock chart requires an array of 4 numbers for each riser: [high, low, open, close].
- The first two numbers (high/low) define the high/low line that draws up and down from the box. The second two numbers (open/close) draw the open/close box riser.
- If either high or low is null, the high-low line is not drawn.
- If either open or close is null, the open-close box is not drawn.
- Use stockProperties to control the general appearance of a stock chart
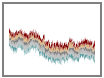
A streamgraph is a simplified version of a stacked area chart. In a streamgraph, there are no axis or gridlines. The baseline is free which makes it easier to perceive the thickness of any given layer across the data. A streamgraph does not use data text labels. The data required to draw a streamgraph is the same format required to draw an area chart. However, streamgraphs are normally given many series (10 or more), each with many data point points (100 or more). A typical streamgraph would include 20 series with 400 data points in each series.
props = {
catchErrors: false,
data: [
[76, 23, 21, 51, 51, 38, 24, 63, 44, 91, 19, 32, 4, 84, 19, 87, 55, 23, 43, 76, 96, 92, 90, 6, 32, 51, 86, 97, 66, 97, 65, 62, 7, 95, 73, 34, 2, 10, 39, 9, 79, 28, 12, 3, 50, 94, 38, 64, 22, 13, 56, 20, 21, 17, 83, 14, 58, 79, 82, 69, 67, 15, 1, 83, 67, 29, 97, 24, 1, 16, 99, 10, 25, 85, 58, 47, 39, 6, 85, 51, 56, 32, 73, 45, 56, 26, 88, 24, 44, 56, 84, 49, 70, 27, 76, 3, 23, 94, 64, 6],
[70, 65, 4, 29, 96, 65, 11, 30, 72, 30, 60, 25, 80, 8, 44, 62, 46, 4, 31, 16, 2, 81, 51, 13, 99, 73, 77, 53, 53, 2, 9, 30, 2, 44, 39, 7, 70, 33, 33, 77, 25, 50, 97, 44, 25, 57, 18, 81, 70, 5, 15, 21, 86, 60, 75, 12, 77, 96, 67, 8, 19, 57, 96, 83, 63, 89, 69, 90, 24, 1, 12, 87, 70, 23, 49, 89, 19, 6, 65, 48, 11, 82, 60, 49, 88, 64, 17, 49, 49, 13, 39, 44, 92, 14, 93, 18, 91, 82, 28, 26],
[62, 17, 91, 57, 98, 58, 41, 66, 79, 59, 20, 81, 28, 10, 34, 10, 76, 97, 80, 47, 5, 69, 3, 24, 92, 63, 0, 56, 20, 57, 82, 74, 98, 49, 63, 77, 50, 23, 20, 54, 54, 92, 62, 36, 6, 22, 97, 49, 31, 39, 46, 38, 24, 83, 47, 50, 26, 33, 61, 93, 18, 5, 0, 1, 49, 99, 56, 89, 43, 6, 97, 54, 12, 24, 20, 6, 95, 8, 30, 13, 98, 30, 63, 65, 49, 81, 12, 42, 42, 80, 90, 64, 56, 74, 51, 88, 92, 65, 51, 65],
[72, 72, 32, 28, 82, 2, 33, 45, 14, 76, 33, 21, 29, 25, 85, 18, 54, 62, 16, 87, 17, 89, 68, 66, 68, 22, 96, 9, 2, 87, 52, 34, 98, 53, 82, 9, 30, 64, 12, 50, 30, 71, 61, 78, 49, 6, 14, 57, 86, 97, 28, 20, 89, 16, 94, 65, 37, 44, 66, 70, 34, 6, 26, 35, 31, 27, 83, 39, 38, 47, 29, 21, 3, 71, 55, 63, 51, 9, 22, 72, 25, 92, 31, 89, 41, 26, 45, 10, 10, 9, 25, 83, 48, 37, 84, 85, 29, 46, 33, 20],
[15, 4, 63, 47, 48, 14, 95, 40, 84, 20, 41, 89, 56, 29, 91, 14, 61, 26, 93, 78, 29, 86, 27, 69, 60, 19, 68, 7, 53, 43, 90, 36, 97, 63, 72, 72, 28, 88, 17, 80, 67, 21, 89, 2, 69, 51, 32, 90, 72, 76, 7, 48, 57, 81, 22, 92, 13, 37, 86, 68, 88, 62, 95, 56, 56, 87, 22, 16, 94, 65, 35, 35, 72, 97, 51, 77, 94, 27, 14, 18, 21, 81, 65, 81, 34, 50, 39, 24, 67, 48, 51, 19, 56, 80, 24, 24, 20, 68, 98, 97],
[24, 12, 26, 53, 40, 28, 71, 52, 83, 96, 76, 19, 37, 65, 60, 65, 84, 76, 24, 83, 44, 42, 33, 21, 48, 88, 19, 14, 45, 37, 13, 1, 98, 56, 83, 89, 96, 17, 49, 19, 88, 95, 92, 18, 45, 12, 31, 57, 86, 35, 78, 59, 36, 0, 31, 12, 81, 62, 47, 61, 51, 84, 85, 74, 85, 3, 43, 10, 35, 89, 21, 23, 29, 50, 69, 31, 42, 70, 66, 13, 16, 67, 63, 81, 89, 97, 65, 94, 62, 30, 2, 26, 34, 11, 36, 99, 48, 19, 18, 65],
[15, 26, 91, 40, 66, 6, 44, 55, 33, 84, 41, 67, 88, 88, 60, 61, 82, 81, 7, 35, 76, 11, 69, 29, 33, 86, 39, 52, 96, 23, 5, 92, 50, 86, 24, 32, 36, 99, 86, 75, 10, 46, 74, 33, 88, 2, 41, 32, 34, 30, 31, 46, 40, 45, 41, 1, 66, 48, 69, 52, 92, 87, 92, 25, 67, 9, 3, 42, 11, 77, 59, 3, 23, 22, 94, 0, 65, 65, 94, 15, 80, 58, 10, 18, 28, 52, 68, 96, 45, 34, 42, 91, 68, 35, 94, 20, 65, 93, 75, 1],
[17, 93, 94, 95, 61, 76, 41, 23, 61, 45, 54, 99, 27, 31, 36, 39, 10, 81, 43, 64, 6, 92, 70, 55, 75, 3, 21, 10, 52, 55, 31, 0, 71, 37, 89, 80, 50, 6, 27, 79, 55, 72, 65, 69, 80, 67, 94, 33, 76, 25, 48, 76, 99, 54, 79, 27, 89, 64, 65, 15, 57, 50, 61, 19, 61, 45, 30, 45, 4, 93, 98, 86, 73, 18, 50, 53, 63, 91, 0, 95, 86, 51, 57, 22, 14, 5, 58, 73, 13, 18, 21, 1, 75, 17, 10, 80, 68, 74, 66, 4],
[91, 3, 8, 41, 12, 50, 44, 50, 29, 42, 77, 35, 18, 8, 29, 41, 64, 10, 3, 46, 28, 36, 61, 27, 64, 24, 88, 91, 0, 99, 91, 10, 95, 41, 61, 75, 22, 62, 72, 81, 73, 2, 94, 79, 41, 24, 85, 77, 61, 15, 80, 5, 83, 80, 23, 25, 91, 75, 8, 30, 81, 94, 4, 41, 74, 69, 19, 20, 33, 84, 29, 69, 52, 15, 94, 72, 70, 24, 57, 17, 42, 39, 80, 72, 68, 60, 1, 3, 57, 24, 93, 10, 1, 82, 98, 34, 33, 52, 20, 61],
[40, 71, 2, 29, 53, 37, 79, 18, 47, 29, 23, 15, 9, 43, 81, 19, 17, 24, 79, 23, 8, 31, 42, 77, 74, 99, 41, 13, 42, 40, 22, 72, 51, 13, 66, 20, 40, 46, 40, 2, 64, 74, 8, 96, 88, 25, 80, 46, 3, 30, 6, 26, 86, 0, 92, 51, 88, 17, 89, 0, 71, 41, 48, 41, 62, 40, 81, 29, 79, 84, 74, 86, 88, 45, 32, 53, 62, 24, 54, 60, 48, 16, 93, 50, 7, 87, 64, 1, 7, 68, 77, 52, 2, 79, 1, 72, 66, 25, 10, 23],
[0, 64, 34, 26, 8, 33, 90, 5, 26, 70, 66, 29, 41, 53, 55, 55, 49, 38, 73, 21, 1, 98, 52, 98, 41, 66, 48, 60, 56, 7, 11, 38, 33, 90, 13, 8, 85, 87, 70, 18, 31, 58, 93, 4, 39, 76, 16, 60, 40, 43, 11, 55, 49, 69, 26, 6, 59, 63, 70, 50, 78, 19, 32, 14, 97, 48, 52, 44, 22, 38, 74, 40, 60, 17, 47, 28, 32, 30, 58, 62, 1, 95, 72, 49, 79, 3, 23, 80, 19, 95, 10, 24, 13, 47, 10, 74, 64, 81, 71, 37],
[90, 67, 37, 13, 99, 45, 64, 80, 21, 36, 8, 58, 91, 44, 16, 30, 39, 85, 3, 54, 58, 9, 14, 12, 37, 53, 66, 0, 91, 2, 56, 63, 10, 67, 4, 67, 47, 48, 62, 3, 10, 16, 18, 40, 20, 31, 45, 5, 12, 6, 66, 66, 78, 77, 94, 23, 38, 54, 28, 73, 38, 63, 17, 23, 16, 90, 71, 67, 81, 33, 36, 13, 31, 82, 61, 50, 10, 68, 63, 85, 42, 37, 80, 64, 36, 88, 82, 64, 1, 78, 30, 47, 88, 35, 5, 20, 69, 89, 56, 84],
[45, 86, 95, 82, 58, 11, 18, 37, 75, 12, 77, 87, 44, 18, 16, 53, 82, 7, 78, 43, 33, 64, 47, 5, 67, 47, 62, 17, 65, 21, 86, 10, 56, 43, 65, 80, 61, 44, 20, 38, 40, 86, 16, 53, 59, 72, 15, 8, 52, 76, 36, 53, 72, 83, 86, 57, 6, 72, 19, 43, 70, 55, 10, 56, 23, 38, 19, 5, 96, 92, 16, 57, 97, 90, 77, 53, 6, 66, 95, 65, 68, 67, 85, 38, 61, 92, 29, 4, 72, 93, 1, 23, 35, 72, 28, 0, 59, 82, 38, 84],
[17, 13, 2, 61, 76, 89, 59, 75, 0, 13, 41, 45, 76, 75, 82, 99, 25, 49, 17, 22, 59, 35, 11, 17, 3, 93, 69, 12, 33, 13, 50, 25, 27, 37, 36, 82, 14, 44, 54, 54, 54, 0, 64, 84, 52, 29, 92, 42, 93, 20, 87, 4, 77, 52, 84, 10, 34, 53, 67, 88, 81, 82, 80, 47, 99, 19, 66, 10, 18, 21, 41, 83, 66, 41, 93, 3, 70, 45, 77, 34, 38, 59, 32, 75, 71, 98, 16, 54, 19, 76, 6, 61, 14, 47, 52, 68, 53, 84, 10, 45],
[80, 52, 89, 93, 58, 68, 99, 0, 20, 73, 83, 61, 40, 60, 8, 10, 5, 62, 94, 83, 61, 91, 76, 33, 72, 15, 84, 79, 28, 70, 14, 68, 63, 33, 0, 7, 59, 58, 84, 89, 22, 76, 50, 99, 65, 47, 26, 76, 94, 4, 37, 56, 19, 2, 51, 0, 76, 39, 2, 63, 88, 13, 4, 62, 53, 73, 30, 53, 61, 63, 6, 78, 30, 31, 98, 58, 41, 64, 34, 96, 86, 79, 74, 66, 84, 60, 83, 66, 81, 83, 96, 85, 23, 54, 97, 0, 76, 79, 10, 6],
[40, 7, 13, 50, 47, 90, 84, 15, 6, 12, 91, 45, 40, 76, 39, 78, 87, 92, 12, 45, 32, 71, 22, 58, 90, 29, 66, 11, 35, 25, 40, 38, 15, 38, 59, 15, 19, 68, 61, 64, 78, 32, 10, 87, 28, 37, 73, 49, 19, 47, 25, 32, 50, 4, 43, 2, 44, 69, 34, 47, 14, 76, 92, 87, 29, 84, 62, 5, 86, 55, 79, 78, 6, 52, 73, 59, 58, 64, 2, 99, 11, 58, 3, 70, 58, 56, 61, 23, 1, 52, 81, 37, 42, 16, 66, 72, 80, 39, 56, 41],
[36, 88, 40, 92, 47, 3, 65, 52, 83, 33, 97, 14, 33, 95, 16, 89, 0, 79, 67, 38, 1, 73, 63, 21, 33, 50, 19, 62, 45, 40, 25, 73, 61, 92, 73, 57, 15, 6, 24, 72, 38, 17, 69, 21, 18, 33, 36, 64, 36, 2, 6, 0, 58, 25, 17, 81, 42, 39, 35, 67, 69, 7, 45, 41, 5, 49, 12, 58, 14, 56, 89, 71, 1, 99, 67, 70, 87, 74, 37, 49, 98, 5, 73, 1, 49, 60, 99, 99, 54, 37, 61, 58, 5, 80, 88, 58, 9, 31, 95, 29],
[69, 62, 87, 27, 53, 13, 4, 72, 48, 37, 99, 2, 39, 21, 88, 19, 12, 54, 76, 92, 89, 86, 64, 3, 4, 95, 23, 35, 42, 95, 74, 6, 96, 83, 3, 98, 4, 90, 33, 11, 73, 60, 60, 70, 5, 66, 12, 61, 29, 34, 30, 6, 79, 10, 41, 77, 7, 14, 57, 93, 55, 44, 21, 77, 92, 18, 39, 15, 82, 71, 4, 17, 28, 74, 29, 29, 72, 64, 40, 80, 73, 35, 84, 10, 0, 47, 9, 93, 96, 86, 45, 40, 26, 51, 2, 35, 93, 75, 71, 53],
[6, 19, 45, 98, 42, 53, 5, 33, 69, 14, 89, 42, 94, 68, 59, 6, 66, 26, 71, 93, 36, 40, 47, 51, 85, 40, 95, 93, 29, 75, 36, 81, 65, 18, 67, 44, 60, 93, 62, 79, 46, 86, 59, 35, 24, 53, 65, 73, 57, 39, 45, 23, 41, 72, 57, 99, 74, 67, 75, 81, 6, 75, 70, 48, 49, 76, 60, 52, 4, 94, 10, 75, 44, 88, 96, 89, 57, 7, 38, 13, 21, 58, 54, 35, 84, 32, 23, 43, 44, 55, 13, 48, 36, 34, 17, 20, 7, 59, 34, 51],
[95, 3, 57, 88, 79, 13, 30, 4, 52, 32, 6, 68, 17, 38, 77, 26, 82, 52, 15, 46, 50, 74, 5, 0, 75, 93, 83, 42, 61, 33, 47, 58, 61, 0, 4, 58, 14, 12, 95, 67, 39, 28, 56, 15, 75, 73, 45, 15, 99, 80, 75, 20, 72, 95, 8, 97, 79, 87, 57, 92, 67, 73, 35, 5, 58, 46, 70, 82, 47, 7, 75, 3, 76, 61, 27, 87, 10, 61, 85, 19, 56, 41, 4, 97, 33, 52, 61, 9, 11, 6, 48, 35, 48, 48, 97, 66, 96, 52, 93, 35],
[52, 16, 18, 55, 84, 88, 77, 13, 95, 46, 72, 5, 93, 40, 16, 12, 89, 92, 84, 94, 44, 81, 60, 46, 61, 57, 93, 12, 53, 71, 13, 84, 92, 33, 63, 27, 1, 22, 76, 21, 7, 86, 51, 19, 72, 80, 46, 95, 27, 56, 89, 6, 78, 91, 66, 86, 21, 55, 29, 51, 94, 52, 86, 33, 91, 84, 13, 21, 46, 27, 93, 0, 46, 11, 19, 18, 76, 0, 24, 22, 82, 57, 35, 51, 0, 83, 13, 14, 56, 17, 31, 11, 32, 36, 44, 20, 65, 94, 57, 77],
[53, 72, 16, 79, 20, 71, 11, 9, 2, 8, 45, 56, 49, 2, 49, 41, 76, 62, 44, 95, 19, 18, 78, 67, 14, 14, 90, 88, 0, 64, 2, 78, 58, 8, 3, 50, 35, 72, 4, 71, 24, 50, 9, 11, 17, 80, 89, 80, 29, 95, 91, 80, 17, 0, 83, 1, 23, 48, 41, 36, 58, 98, 63, 98, 82, 10, 48, 47, 0, 36, 49, 91, 11, 78, 85, 67, 8, 19, 21, 19, 99, 57, 6, 10, 68, 24, 39, 86, 88, 58, 29, 34, 34, 91, 68, 3, 22, 34, 43, 44]
],
title: {visible: false},
chartType: 'streamgraph',
border: {width: 2, color: 'navy'},
series: [
{series: 0, color: 'cadetblue',label: ' '},{series: 1, color: 'silver',label: ' '},
{series: 2, color: 'grey',label: ' '},{series: 3, color: 'burlywood',label: ' '},
{series: 4, color: 'maroon',label: ' '},{series: 5, color: 'red',label: ' '},
{series: 6, color: 'purple',label: ' '},{series: 7, color: 'fuchsia',label: ' '},
{series: 8, color: 'green',label: ' '},{series: 9, color: 'lime',label: ' '},
{series: 10, color: 'olive',label: ' '},{series: 11, color: 'yellow',label: ' '},
{series: 12, color: 'navy',label: ' '},{series: 13, color: 'blue',label: ' '},
{series: 14, color: 'teal',label: ' '},{series: 15, color: 'aqua',label: ' '},
{series: 16, color: 'aliceblue',label: ' '},{series: 17, color: 'antiquewhite',label: ' '},
{series: 18, color: 'aquamarine',label: ' '},{series: 19, color: 'azure',label: ' '},
{series: 20, color: 'beige',label: ' '},{series: 21, color: 'bisque',label: ' '}
]
Notes:
- The blaProperties that control the format of an area chart do not work for streamgraphs.
- You may use series#.visible=true/false to control the visibility of individual series.
- The xaxis properties that are applicable to an ordinal axis can be used to format labels, title, gridlines and tick marks.
chartType: 'surface3d',
chartFrame: { fill: { color: 'lightgrey' }},
threedProperties: {rotate: 30, tilt: 30},
dataLabels: {visible: false},
legend: {visible: true},
series: [
	{series: 0, color: 'rgb(0,142,126)', label: 'Atlanta'},
	{series: 1, color: 'rgb(152,181,211)', label: 'Baltimore'},
	{series: 2, color: 'rgb(0,101,163)', label: 'Chicago'},
	{series: 3, color: 'rgb(173,204,189)', label: 'Denver'}
],
groupLabels: ["Georgia","Illinois","Colorado"]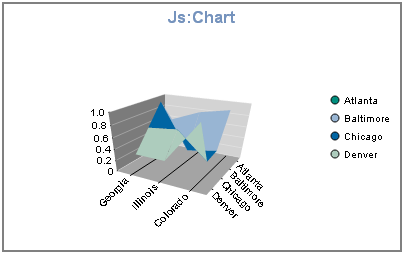
Notes:
- Use threedProperties to define the general layout of the chart.
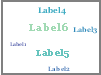
A tagcloud is a visual representation of group labels. The size of each label is proportional to its data value. Labels are defined in the groupLabels property. For example, chart.groupLabels = ['A', 'B', 'C'] and chart.data = [[10, 20, 30]] would draw three labels 'A', 'B', 'C', and the 'C' label would be 3 times larger than 'A'.
groupLabels: ['Label1','Label2','Label3','Label4','Label5'],
data: [[10,20,30,40,50]],
xaxis: {min: 10, max: 50},
chartType: 'tagcloud'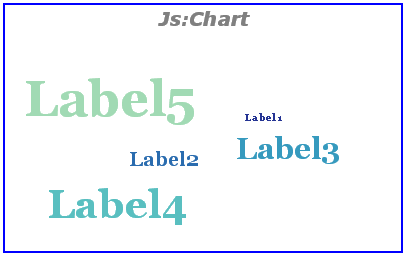
- The tagcloud chart also supports an optional second series of data, which is used to drive the *color* of each label. Colors are chosen from the yaxis.colorScale property.
- The tagcloudProperties.maxNumberOfTags property can be used to limit the number of labels.
- The xaxis.min and xaxis.max properties control the minimum/maximum label scaling.
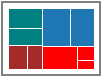
Treemaps can be defined by a data object or an array of arrays.
An object can be nested arbitrarily deep. Any properties in the data object with numeric values will be drawn as a single rectangle in the treemap.
chartType: 'treemap',
data: {
	leaf1: 10,
	leaf2: 20,
	child1: {
		childLeaf1: 15,
		childLeaf2: 18,
		childChild2: {
			childChildLeaf1: 22,
			childChildLeaf2: 7,
		}
	},
	leaf3: 30,
	child2: {
		childLeaf1: 15,
		childLeaf2: 18,
	}
},
series: [
{series: 0, color: 'lightgreen'},
{series: 1, color: 'lightblue'},
{series: 2, color: 'yellow'},
{series: 3, color: 'pink'},
{series: 4, color: 'orange'},
]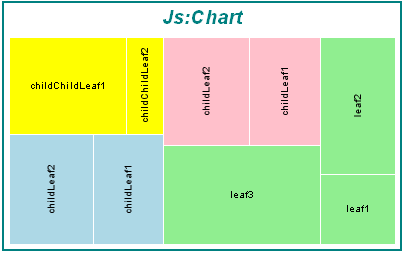
For an array definition, each array in the top level array creates one new node in the tree (either a parent or a leaf). The internal arrays should have three entries:
[nodeName (string), parentName (string or undefined), value (number or undefined)]The nodeName is required. If parentName is undefined, this node is treated as a root node. If value is a number, this node is a leaf, otherwise this node is a parent node. Example:
data: [
   ['leaf_1', undefined, 5],
   ['child_1', undefined, undefined],
   ['child_Leaf_1', 'child_1', 15]
],
chartType: 'treemap'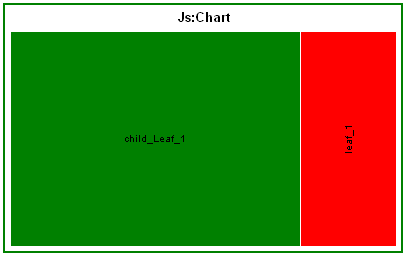
Notes:
- treemapProperties control the appearance of cell headers and cell borders.
- Cells in a treemap can be colored by series color or by the colors defined in yaxis.ColorScale.
data: [[100,10, 20, 130, -30, -40]],
chartType: 'waterfall',
blaProperties: {orientation: 'vertical'},
groupLabels: ['Initial', 'A', 'B', 'Subtotal', 'C',  'D','Total'],
waterfallProperties: {
	appendTotalRiser: true,
	positiveRiserColor: '#77b39a',
	negativeRiserColor: '#e2675b',
	zeroRiserColor: '#7593bd',
	subtotalRisers: ['Subtotal'],
	connectorLine: {
		width: 1,
		color: 'red',
		dash: ''
	}
},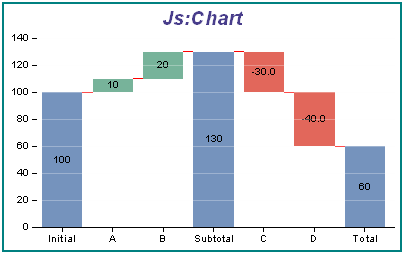
Notes:
- Waterfall charts graphically illustrate the cumulative effect of sequentially introducing positive or negative values to an initial value. The initial and final (or total) values are represented by whole columns drawn from the ordinal axis baseline. Intermediate positive and negative values are drawn as floating columns.
- Use the properties in the waterfallProperties group to define the general layout of a waterfall chart.