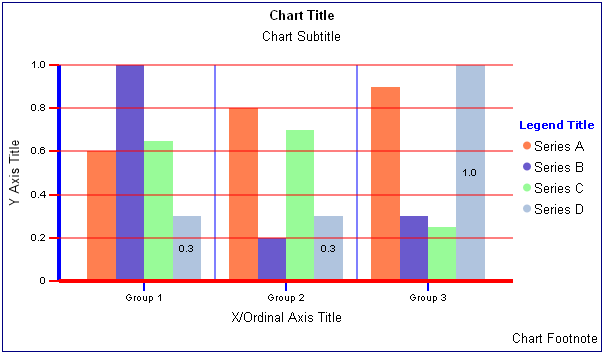
These properties control the visibility and format of chart titles (Title, Subtitle, and Footnote). The following code segment shows the default values from the properties.js file:
title: {
	text: 'Chart Title',
	visible: true,
	align: 'center',  // One of 'left', 'center', 'right', 'chartFrame'
	font: 'bold 10pt Sans-Serif',
	color: 'black',
	tooltip: undefined
},
subtitle: {
	text: 'Chart Subtitle',
	visible: false,
	align: 'center',  // One of 'left', 'center', 'right', 'chartFrame'
	font: '10pt Sans-Serif',
	color: 'black',
	tooltip: undefined
},
footnote: {
	text: 'Chart Footnote',
	visible: false,
	align: 'center',  // One of 'left', 'center', 'right', 'chartFrame'
	font: '10pt Sans-Serif',
	color: 'black',
	tooltip: undefined
},
Click on a Chart Title in the image -- OR -- Click a link in the Properties panel for information about individual titles