


Intelligent Interactive Dashboards
- a Useful & Easy-to-Use Concept in Interactive Dashboards
- a Tool to Facilitate Goal-Based Rational Decisions
- a Unique combination of dashboard interactivity & financial analysis
Real-Business Example
"Can a company reduce its Break Even Units from 10K to 5K?"With a Conventional Interactive Dashboard, the answer to this question is an iterative process of adjusting constituent variables in a table until an approximate goal value is achieved.
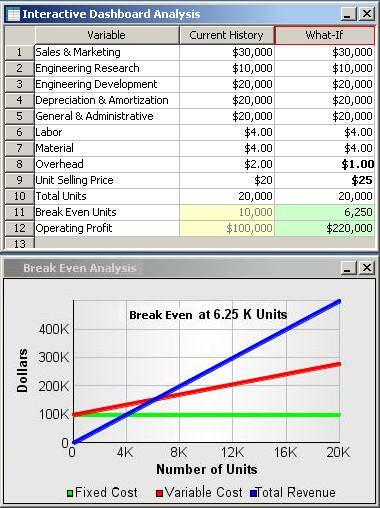
With Three D Graphics Intelligent Interactive Dashboards, drag the slider to the 5K goal value and the dashboard tells you how to achieve it.
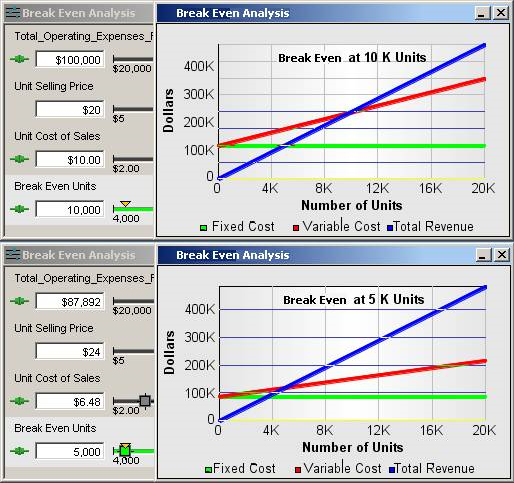
Three D Graphics Intelligent Interactive Dashboards let the user set min/max limits to prevent pursuit of unrealistic goals.
And, if a goal cannot be achieved, a Best Solutions dialog clearly tells you why & offers alternatives.
Real-Business Example
"What are the problems in establishing a Sinking Fund?"In theory, given a linear example and attention paid to "limits", a top down "what-if" can be achieved with a Conventional Interactive Dashboard through iterative entries. Even bottom up is possible but the iteration chore is substantially greater and easily abandoned.
A non-linear example - most particularly with multiple roots involved - is another matter indeed. With a Conventional Interactive Dashboard, top down iteration is tricky, at best. Bottom up iteration is a non-starter.
In this example, there are three root variables that contribute, noting the constraints, to a Sinking Fund Goal which may or may not be attainable - given those constraints. Given the breadth of combinations, the User is offered a number of "solutions".
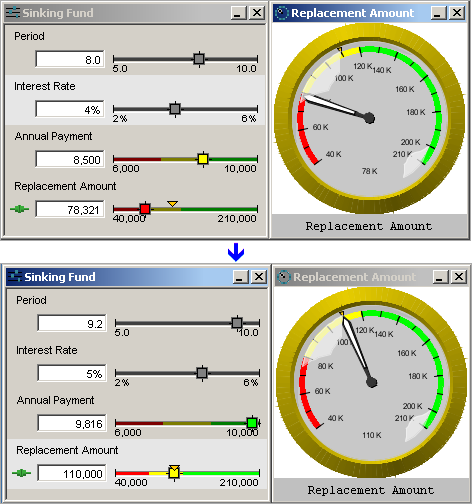
Clearly, there is no single solution. With Three D Graphics Intelligent Interactive Dashboards, it is a simple and easy matter to examine and resolve these options: Relax the Sinking Fund Goal, and/or seek a better Interest Rate, and/or accept a longer period, and/or revise the periodic Payment, and/or some combination.
License Fee Schedule (per Site)
- One User: $995
- Three to Five Users: $995 per User
- Six to Ten Users: $495 per User
- Eleven to Twenty-five Users: $395 per User
- Twenty-six + Users: Contact us about a Site License
- Enterprise Unlimited Users, unlimited servers, desk top or client server: Contact us.
- Deliverables:
- One Application per User
- User Guide (reproducible)
- Tutorial-based sample, design-time & run-time, (reproducible) with 2-hour telephone run-through
- Available consulting and training
- First year update & maintenance support; succeeding years 25% of first year
For a detailed look at Three D Graphics Intelligent Interactive Dashboards, please download and view our Power Point Presentation.
For more information, or to order Three D Graphics Intelligent Interactive Dashboards, please contact us:
- Email: info@threedgraphics.com
- Phone: 1-310-231-3330
- Fax: 1-310-231-3303
Intelligent Interactive Dashboards
a powerful tool to make
business intelligence more intelligent