|
Welcome to Charts Unlimited for IBM Cognos Series 7 Impromptu!
About five years ago, Cognos elected to freeze the chart expressions in Series 7, Impromptu and PowerPlay
- technology licensed from Three D Graphics. In the ensuing period there has been a significant advance in
every aspect of chart technology, led by Three D Graphics - the leader in the field. The result is Charts
Unlimited for IBM Cognos Series 7 Impromptu (to be followed later by PowerPlay). For Users of Series 7
Impromptu that have not yet chosen the superb attributes of IBM Cognos 8 BI, Charts
Unlimited is a powerful, single click electable, exchange replacement chart library, fully and
totally supported by Three D Graphics.
- Operations: Assisted by more than 100 new macros, achieve superior Ease of Use, Usefulness and Usability.
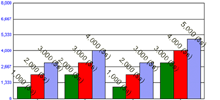
- Performance: Receive an additional complement of chart types responsive to every need and application.
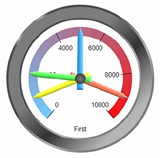
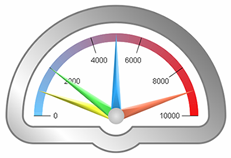
- Aesthetics: New expert pie labeling, perfect anti-aliasing, great multi-dimensional gauges, transparencies and more
Features:
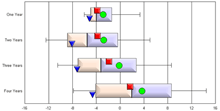
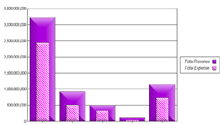
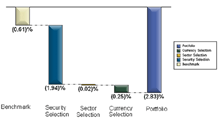
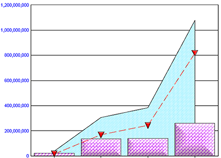
- Additional Chart Types: Box Plots (Horizontal & Vertical), Error Bars, Gantt Charts, Gauges, Pareto Charts, Waterfall Charts and many more...
- Full support for P-charts, X-bar charts, range charts and all other Six Sigma graphs in
conjunction with the current Series 7 step-line, error-bar, range-line and SPC chart capability.
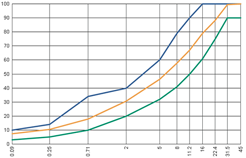
- Axis manipulation macros for X, Y, Dual-Y, & Special (i.e., time) axes can be
used to define precision, min/max scale values, grid lines, & special formatting.
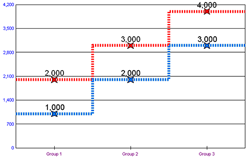
- Series & Groups: Swap, sort, and apply special formatting to All or Individual Series & Groups.
- Labels: Redefine Series & Group Labels & apply Special Formatting
- Special Effects: State of the art anti-aliasing together with enhanced bevel, soft shadow, and transparency effects add both sizzle and sophistication.
- User Defined Lines & Labels: Can be drawn at any point in the chart on an X-Axis, a Y-Axis, or between two X/Y coordinates. Labels can be formatted with any resident font.
- User Defined Fill Areas & Labels:
Rectangles and ovals can be drawn above or behind the plot area and can be outlined, color-filled, or pattern-filled.
Labels can be formatted with any resident font.
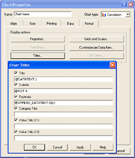
- Use the existing Impromptu Chart Properties dialog to enable Charts Unlimited features & functions
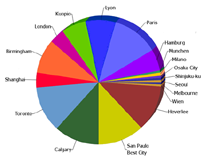
- Pie Label Layout: Label placement on single and multiple pie charts are both interesting and intelligible
- Single- and Multiple-Pie engine with multi-faceted labeling capability eliminates the interferences that exist in Series 7.
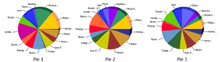
- Pie Label placement is even more noticeable and dramatic when multiple Pie charts are displayed on a single graph.
Benefits:
- Resolution of the vexatious issues that have plagued the current Series 7 Impromptu chart expression:
- Programmatic control over dozens of chart properties like min/max scale range, hi-light colors, reference lines, etc.
- Set chart parameters at run-time instead of design-time.
- Complete and easy methods to pivot and swap data in the chart .
- Control over null-to-zero and zero-to-null conversions, numeric formatting and more.
- Improved automatic layout routines that guarantee professional looking charts with well formatted labels, no matter how complex the dataset.
For an in depth look at everything Charts Unlimited
has to offer, feel free to download our Power Point presentation (2.8MB)
From here, if you want to see some sample reports created by Charts
Unlimited, try our Samples Page. Pricing and Licencing information
is available on our Buying Page. You can also download a Demo version,
browse the Online Documentation, or Contact Us for more information.
Back To Top
|