
When axis text is automatically fitted (e.g., O1LabelAutofit or Y1LabelAutofit is true) and AxisTextAutofitMode is set to zero, this property defines the maximum size of autofitted axis text in virtual coordinates.
DATA TYPE:
integer
RANGE:
Any integer value. It should be greater than AxisTextAutofitMin.
DEFAULT:
2000
SYNTAX:
EXAMPLE:
ALSO SEE:
When axis text is automatically fitted (e.g., O1LabelAutofit or Y1LabelAutofit is true) and AxisTextAutofitMode is set to zero, this property defines the minimum size of autofitted axis text in virtual coordinates.
DATA TYPE:
integer
RANGE:
Any integer value. It should be less than AxisTextAutofitMax.
DEFAULT:
500
SYNTAX:
ALSO SEE:
This property selects the mode in which AxisTextAutofitMin, AxisTextAutofitMax, and AxisTextAutofitPercent properties are used.
DATA TYPE:
integer
RANGE:
0...2; 0 = Normal autofit behavior, within limits of AxisTextAutofitMin and AxisTextAutofitMax, 1 = All axis text matches the Axis with the smallest font size as determined by autofit, 2 = All axis text is maintained within "X percent" of the Axis with the smallest font size as determined by autofit
DEFAULT:
0 (Normal autofit behavior)
SYNTAX:
EXAMPLE:
ALSO SEE:
AxisTextAutofitMin, AxisTextAutofitMax, AxisTextAutofitPercent
When AxisTextAutofitMode(2) is used, this property selects the percent at which Axis text is maintained within the smallest font size as determined by Autofit. The default value of ten percent is almost identical to AxisTextAutofitMode(1).
DATA TYPE:
integer
RANGE:
0...100%
DEFAULT:
10%
SYNTAX:
EXAMPLE:
ALSO SEE:
This property reverses the text alignment of all objects and the location of legend text next to label markers. This property is provided for international support ONLY! It can be used to make the entire chart read from right-to-left or left-to-right. However, note that BiDirectional(true) does not reverse the values of the associated properties and methods. They retain their original values. For example, getTextJustHoriz() would return zero (left) even though visually the text is aligned right by BiDirectional(true).
DATA TYPE:
boolean
RANGE:
true = Enable Right-to-Left Alignment, false = Select normal Left-to-Right Alignment
DEFAULT:
false
SYNTAX:
EXAMPLE:
NOTE:
Use this property with great care! Your application must keep track of the BiDirectional setting and handle the reverse values supplied by associated properties and methods.
This property is not intended for use in a normal charting environment. It is strictly designed for a programmer to determine how setting a method or property may affect other properties and methods. When enabled (the default), the normal relationship between properties and methods is observed. When disabled, setting chart characteristics with a method or property will not affect settings by other properties and methods. By default, some properties and methods actually call other properties/methods. When Cascade is set to false, properties/methods will never call other properties/methods.
DATA TYPE:
boolean
RANGE:
true = Enable cascade mode, false = Disable cascade mode
DEFAULT:
true
SYNTAX:
EXAMPLE:
With Cascade(true), setBorderColor() will change the border color of series 3 and override the transparent setting.
setDepthAngle(0);
setDepthRadius(0);
setCascade(true);
setTransparentBorderColor(getSeries(3),true);
setBorderColor(getSeries(3),new
Color (255,0,0));
With Cascade(false), setBorderColor() will not change the border color of series 3 because the border has been set to transparent.
setDepthAngle(0);
setDepthRadius(0);
setCascade(false);
setTransparentBorderColor(getSeries(3),true);
setBorderColor(getSeries(3),new Color (255,0,0));
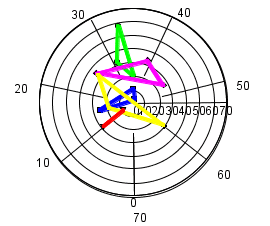
This property gets/sets the start angle to draw any circular chart (polar, radar, pie).
DATA TYPE:
integer
RANGE:
0...359
DEFAULT:
0
SYNTAX:
EXAMPLE:
setGraphType(65);
setCircularChartStartAngle(359);
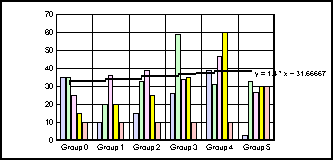
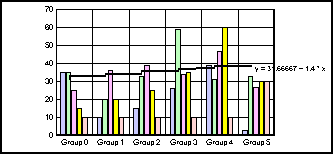
The value assigned to this property determines whether the equation associated with a curve fit line is shown. The curve fit line is drawn by the setCurveFitType() method.
DATA TYPE:
boolean
RANGE:
true = Show equation with the curve fit line, false = Do not show equation
DEFAULT:
true
SYNTAX:
ALSO SEE:
When a curve fit equation is displayed with CurveFitEquationDisplay, this property determines the order of terms for equation text (TRUE: ax + b; FALSE: b + ax)
DATA TYPE:
boolean
RANGE:
true/false; true = ax + b, false = b + ax
DEFAULT:
true
SYNTAX:
EXAMPLE:
setCurveFitType(1,1);
setCurveFitHighOrderFirst(true);
setCurveFitHighOrderFirst(false);
ALSO SEE:
This property determines the number of interpolated points to calculate to draw a curve fit line. The curve fit line is enabled/disabled with the setCurveFitType() method.
DATA TYPE:
integer
RANGE:
Any integer. Larger values will draw a smoother line.
DEFAULT:
50
SYNTAX:
ALSO SEE:
This property defines a default font that will be applied to all text objects in a chart. You can apply different fonts to individual text objects using the setFontName() method.
DATA TYPE:
String
RANGE:
Any font name string.
DEFAULT:
Sans Serif
SYNTAX:
Example::
setDefaultFontName("Comic Sans MS");
setGraphType(41);
This property defines the document height in TWIPs (1/20th point or 1/100th millimeter). The document size set by this property and DocumentWidthInTwips is used is used as a reference to calculate the size of text using absolute font sizes. If no document size is specified, the size of the chart in pixels and the screen resolution are used for conversion (from pixels to points). If no document size is specified (no screen resolution available), the convertion from pixels to points is simpy 1 to 1.
DATA TYPE:
integer
RANGE:
0...10000
DEFAULT:
0(use the size in pixels at the given resolution)
SYNTAX:
NOTE:
If DocumentHeightInTwips is non-zero, Perspective will also put the size in pixels in the SVG viewport.
ALSO SEE:
DocumentWidthInTwips, getDocumentHeightInPoints(), getDocumentWidthInPoints(), setFontSizeAbsolute(), setFontSizeInPoints()
This property defines the document width in TWIPs (1/20th point or 1/100th millimeter). The document size set by this property and DocumentHeightInTwips is used is used as a reference to calculate the size of text using absolute font sizes. If no document size is specified, the size of the chart in pixels and the screen resolution are used for conversion (from pixels to points). If no document size is specified (no screen resolution available), the convertion from pixels to points is simpy 1 to 1.
DATA TYPE:
integer
RANGE:
0...10000
DEFAULT:
0(use the size in pixels at the given resolution)
SYNTAX:
NOTE:
If DocumentWidthInTwips is non-zero, Perspective will also put the size in pixels in the SVG viewport.
ALSO SEE:
DocumentHeightInTwips, getDocumentHeightInPoints(), getDocumentWidthInPoints(), setFontSizeAbsolute(), setFontSizeInPoints()
This property enables/disables showing a riser's bar value when a bar is resized in a clustered bar chart. When enabled (true), the chart will show the bar value when a bar is resized using the option key. When disabled (false), the bar value is not shown.
DATA TYPE:
boolean
RANGE:
true/false; true = Show riser's bar value, false = Do not show riser's bar value
DEFAULT:
true
SYNTAX:
This property controls manual redrawing of the chart when chart properties are changed. When this property is enabled and other chart properties and attributes are changed, the appearance of the chart is not changed. When this property is false, the chart is redrawn with the new attribute when any chart property is changed.
DATA TYPE:
boolean
RANGE:
true / false; true = Do not automatically redraw the chart when attributes are changed, false = Automatically redraw the chart when attributes are changed
DEFAULT:
false
SYNTAX:
This property allows/disallows axis titles to be dragged with the mouse. A axis title string must be defined (e.g., setO1TitleString("O1-Axis Title");).
DATA TYPE:
boolean
RANGE:
true/false; true = allow axis titles to be moved, false = titles cannot be moved.
DEFAULT:
false
SYNTAX:
This property enables/disables the the nested labels callback interface. If this property is enabled, you must create your own version of the callback which must implement ALL of the abstract methods defined in TDGNestedLabel.Java:
In addition to creating these methods, you must use the getO1LabelCallback() method to define the callback.
DATA TYPE:
boolean
RANGE:
true/false; true = enable nested labels, false = disable nested labels
DEFAULT:
false
SYNTAX:
NOTE:
Use getO1LabelCallback() to determine if a callback has been assigned with setO1LabelCallback.
ALSO SEE:
This property enables (true) / disables (false) output in Scalable Vector Graphics (SVG) format by the sendSVGToStream() method.
DATA TYPE:
boolean
RANGE:
true / false; true = Allow output in SVG format, false = Do not allow output in SVG format
DEFAULT:
true
SYNTAX:
ALSO SEE:
DocumentHeightInTwips, DocumentWidthInTwips, sendSVGToStream()
This property enables/disables smoother drawing of chart objects using Java 2D. Your development environment must include JRE 1.2 (or later) in order to use this property.
DATA TYPE:
boolean
RANGE:
true (enable) / false (disable)
DEFAULT:
false
SYNTAX:
ALSO SEE:
TextAntialiasing to improve the quality of text objects
This property enables (true) / disables (false) the user's ability to move and resize title, subtitle, footnote, chart frame, and legend box objects in a chart.
DATA TYPE:
boolean
RANGE:
true / false; true = User can move/resize objects, false = Objects cannot be moved/resized by the user interface
DEFAULT:
true
SYNTAX:
ALSO SEE:
This property enables/disables resize bar mode. When it is enabled, the user interface will allow resizing of bars. The user can change the size of bars by using the control key and the mouse to stretch or reduce their size. This action will also change the internal data value assigned to the bar. The getDataValue() method can be used to get the new data value. If data callbacks are being used to provide data input to the chart (see Chapter 6), any resize operation will be reset to the value provided by the data call back. When this property is disabled, the user cannot resize bars. This property is only applicable to 2D and 2.5D bar charts, it is not supported for 3D risers.
DATA TYPE:
boolean
RANGE:
true / false; true = User interface can resize bars, false = Do not allow resizing of bars
DEFAULT:
true
SYNTAX:
NOTE:
DepthRadius must be set to zero in order for this property to enable the user interface to resize bars.
ALSO SEE:
ReshapeEnable, SelectionEnable, SelectionEnableMove, DepthRadius
This property enables (true) / disables (false) drawing of groups in reverse order.
DATA TYPE:
boolean
RANGE:
true / false; true = Draw groups in reverse order, false = Draw groups in normal order
DEFAULT:
false
SYNTAX:
ALSO SEE:
This property enables (true) / disables (false) drawing of series in reverse order.
DATA TYPE:
boolean
RANGE:
true / false; true = Draw series in reverse order, false = Draw series in normal order
DEFAULT:
false
SYNTAX:
ALSO SEE:
This property defines the user's ability to select objects in a chart and the operations that can be performed when one or more objects are selected.
DATA TYPE:
integer
RANGE:
0...5;
- 0 = No Selection.
- 1 = The user can select individual objects (risers, markers, labels, etc.) in a chart. The charting engine highlights each object that is selected.
- 2 = The user can only select data-related objects (bars, legends, etc.). The charting engine will highlight the selected data objects and all related objects.
- 3 = The user cannot select individual objects. When one object is selected, all related objects will also be selected and highlighted.
- 4 = The user can click on a single point and have the chart zoom at the rate of 50% on both axes with the selected point used as the center of the zoom rectangle.
- 5 = Allows the user to drag out a rectangle and drill-down on the data within the rectangle area. When this mode is used, a single mouse click will back up one data-zoom level or drill-down. double click will restore the original un-zoomed data state.
DEFAULT:
3
SYNTAX:
ALSO SEE:
This property enables (true) / disables (false) a chart user's ability to select and move individual moveable objects (title, subtitle, footnote, chart frame, and legend box) in a chart.
DATA TYPE:
boolean
RANGE:
true / false; true = User can select and move objects, false = Objects can be selected but not moved
DEFAULT:
true
SYNTAX:
ALSO SEE:
This property sets the default value for the X-Offset of a drop shadow.
DATA TYPE:
integer
RANGE:
-20...20
DEFAULT:
2
SYNTAX:
ALSO SEE:
get/setShadowXOffset(), get/setShadowYOffset(), setShadowColor(), setShadowDisplay()
This property sets the default value for the Y-Offset of a drop shadow.
DATA TYPE:
integer
RANGE:
-20...20
DEFAULT:
2
SYNTAX:
ALSO SEE:
get/setShadowXOffset(), get/setShadowYOffset(), setShadowColor(), setShadowDisplay()
This property controls chart resizing.
DATA TYPE:
boolean
RANGE:
true / false; true = set chart size to size of container, false = do not set chart size to size of container
DEFAULT:
true
SYNTAX:
This property enables (true) / disables (false) drawing of smooth lines in line charts.
DATA TYPE:
boolean
RANGE:
true / false; true = draw smooth lines, false = draw lines normally
DEFAULT:
false
SYNTAX:
This property controls smoother drawing of chart text objects using Java 2D. Your development environment must include JRE 1.2 (or later).
DATA TYPE:
boolean
RANGE:
true / false; true = Enable text antialiasing, false = Disable text antialiasing
DEFAULT:
false
SYNTAX:
ALSO SEE:
This property sets the maximum font size in virtual coordinates that automatic fitting will use to fit/size chart labels and legend text. It does not affect the chart title, subtitle, and footnote.
DATA TYPE:
integer
RANGE:
Any integer value
DEFAULT:
1600
SYNTAX:
This property sets the minimum font size in virtual coordinates that automatic fitting will use to size chart labels and legend text. It does not affect the chart title, subtitle, and footnote.
DATA TYPE:
integer
RANGE:
Any integer value
DEFAULT:
50
SYNTAX:
This property controls whether the chart will be drawn directly to the graphics device (true) or using an off-screen image buffer (false). Set this property to false when the drawing speed of the chart seems very slow. When this property is false, it can increase the drawing speed by a factor of three in some situations.
DATA TYPE:
boolean
RANGE:
true / false; true = Draw directly to graphics device, false = Use off screen image buffer
DEFAULT:
true
SYNTAX: