ATTRIBUTE |
Description |
A2D_ADVANCE_CURVEFITS |
Advanced Curvefits on a particular series |
A2D_AUTOFIT_ALL |
Autofit All (global autofitting) |
A2D_AUTOFIT_DATATEXT |
Autofit Data Text |
A2D_AUTOFIT_LEGEND |
Autofit Legend |
A2D_AUTOFIT_O1/O2/X/Y1/Y2 |
Autofit O1, O2, X, Y1, Y2 axis labels |
A2D_BAR_GROUP_SPACING |
Bar Group Spacing in side by side bar chart |
A2D_BAR_RISER_WIDTH |
Bar Riser Width of all risers in a bar chart |
A2D_BASEVALUE_X/Y1/Y2/Y3/Y4 |
Define the base value from which values are drawn |
A2D_BUBBLEGRID_COUNT_X |
Bubble Grid Count on the X-axis |
A2D_BUBBLEGRID_COUNT_Y |
Bubble Grid Count on the Y-axis |
A2D_BUBBLEGRID_POSITION_X |
Bubble Grid Position on the X-Axis |
A2D_BUBBLEGRID_POSITION_Y |
Bubble Grid Position on the Y-Axis |
A2D_COLORBYSERIES |
Color By Series or group |
A2D_CONNECT_STACKBARS |
Connect bars in a stacked bar chart |
A2D_CURVECOLORASSERIES |
Curve Color As Series |
A2D_CURVEMOVING |
Curve Moving average line data points |
A2D_CURVESMOOTH |
Curve Smooth data points |
A2D_DATAFORMAT |
Data Format of data input to a 2D graph |
A2D_DATAFORMAT_VERT |
Data Format Vertical orientation of data points |
A2D_DEPTH_IMS_ANGLE |
Depth Angle of 3D effect on surface areas of a 2D chart |
A2D_DEPTH_IMS_THICK |
Depth Thickness of 3D effect on a 2D chart |
A2D_DEPTH_MODE |
Depth Mode of 3D effect on a 2D chart |
A2D_DIRECTION_X/Y1/Y2/Y3/Y4/Z |
Direction and order of a numeric axis |
A2D_EXCLUDE_ZERO_X/Y1/Y2/Y3/Y4/Z |
Exclude zero as the axis origin based on data range |
A2D_FORMAT_SDLINE |
Format Series-Dependent Line formula and coefficient values |
A2D_FORMAT_SDLINE_ADV |
Format Series-Dependent Line formula and coefficient values advanced |
A2D_FORMAT_X/Y1/Y2/Y3/Y4/Z |
Format numeric axis labels |
A2D_FORMAT_X/Y1/Y2/Y3/Y4/Z_ADV |
Format numeric labels advanced |
A2D_FORMATDTXT_X/Y1/Y2/Y3/Y4 |
Format data text on a numeric axis |
A2D_FORMATDTXT_X/Y1/Y2/Y3/Y4_ADV |
Format data text on a numeric axis advanced |
A2D_GRID_STEP_X/Y1/Y2/Y3/Y4/Z |
Grid Steps on a numeric axis |
A2D_GRIDLINES_ON_TOP |
Gridlines On Top of all other objects in the chart |
A2D_GRIDLINES_X/Y1/Y2/Y3/Y4/Z |
Gridlines on a numeric axis |
A2D_GRIDLINESORD_O1 |
Gridlines on the O1-axis |
A2D_GRIDLINESORD_O2 |
Gridlines on the O2-axis |
A2D_GRIDMODEMAJOR_O1 |
Grid Mode Major on the O1-Axis |
A2D_GRIDMODEMINOR_O1 |
Grid Mode Minor on the O1-Axis |
A2D_HL_COLOR |
Highlight Color of a group in a series |
A2D_IGNORE_GROUPS |
Ignore Group |
A2D_IGNORE_SERIES |
Ignores Series |
A2D_LABELMODE_O1 |
Label Mode on the O1-axis |
A2D_LABELMODE_O2 |
Label Mode on the O2-axis |
A2D_LABELWRAPLINES_O1 |
Label Wrap Lines on the O1-axis |
A2D_LABELWRAPMODE_O1 |
Label Wrap Mode on the O1-axis |
A2D_LEGEND_FANCYBOX |
Legend Fancy Box definition |
A2D_LEGEND_LOCK |
Legend Placement |
A2D_LEGEND_MARKER_ORIENTATION |
Legend Marker Orientation |
A2D_LOCATE_LEGEND |
Locate Legend |
A2D_LOCATE_LINR_TEXT |
Locate Linear Regression Text |
A2D_LOCATE_TITLE_X/Y1/Y2/Y3/Y4 |
Locate a numeric axis title |
A2D_LOG_X/Y1/Y2/Y3/Y4 |
Logarithmic/linear scaling on a numeric axis |
A2D_MANUAL_PICTOGRAPH_SCALE_VALUE |
Unit/Scale to stack pictograms |
A2D_MARKERSHAPE |
Marker Shape in a 2D Chart |
A2D_MARKERSHAPE_SD |
Marker Shape in a 2D Chart for a series |
A2D_MARKERSIZE |
Marker Size in a 2D Chart |
A2D_MARKERSIZE_SD |
Marker Size in a 2D Chart for a series |
A2D_MOVE_SERIES |
Move series in a stacked bar chart |
A2D_MULTI_Y_INFO |
Multi-Y (Y3/Y4) axis information |
A2D_ORD_SPACE_MODE |
Ordinal Axis Space Mode |
A2D_ORIENTATION |
Orientation (horizontal/vertical) of chart |
A2D_PLACE_O1/O2 |
Place data value on risers on an ordinal axis |
A2D_PLACE_X/Y1/Y2/Y3/Y4 |
Place data value on riser on a numeric axis |
A2D_PRESDL_CONN |
Pre-Series Dependent connection line |
A2D_PRESDL_CONNBRK |
Pre-Series Dependent connection line with breaks for missing data points |
A2D_PRESDL_STEP |
Pre-Series Dependent step connection line |
A2D_PRESDL_STEPBRK |
Pre-Series Dependent step connection line with breaks for missing data points |
A2D_PRESDL_STEPVERT |
Pre-Series Dependent vertical step connection line |
A2D_SCALE_X/Y1/Y2/Y3/Y4/Z |
Scaling on a numeric axis |
A2D_SCALEBASE |
Scale Base of negative risers in a 2D chart |
A2D_SCALEEND_O1/O2 |
Scale End on an ordinal axis |
A2D_SCALEEND_X/Y1/Y2/Y3/Y4/Z |
Scale End on a numeric axis |
A2D_SCALEFREQ_BEG_O1/O2 |
Scale Frequency Begin on an ordinal axis |
A2D_SCALEFREQ_BEG_X/Y1/Y2/Y3/Y4 |
Scale Frequency Begin on a numeric axis |
A2D_SCALEFREQ_END_O1/O2 |
Scale Frequency End on an ordinal axis |
A2D_SCALEFREQ_END_X/Y1/Y2/Y3/Y4 |
Scale Frequency End on a numeric axis |
A2D_SCALEFREQ_O1/O2 |
Scale Frequency of labels on an ordinal axis |
A2D_SCALEFREQ_X/Y1/Y2/Y3/Y4 |
Scale Frequency of labels on a numeric axis |
A2D_SCIMOVAVG |
Scientific Moving Average curve definition |
A2D_SD_SHOWDATATEXT |
Series-Dependent Show/Hide DataText |
A2D_SDDATALINE_TYPE |
Series-Dependent Data Line Type (markers, lines, or both) |
A2D_SDEMPHASIZED |
Series-Dependent Emphasize a series |
A2D_SDLINECONN |
Series-Dependent Line Connecting a series |
A2D_SDLINECURV |
Series-Dependent Line Curve connecting a series |
A2D_SDLINELINR_CORR |
Series-Dependent Correction coefficient text |
A2D_SDLINELINR_EXP |
Series-Dependent Exponential linear regression line |
A2D_SDLINELINR_FORMULA |
Series-Dependent Formula text for the linear regression lines |
A2D_SDLINELINR_LINE |
Series-Dependent Linear Regression Line |
A2D_SDLINELINR_LOG |
Series-Dependent common log linear regression line |
A2D_SDLINELINR_NATLOG |
Series-Dependent Natural Log linear regression line |
A2D_SDLINELINR_NPOLY |
Series-Dependent Polynomial fit line |
A2D_SDLINELINR_NPOLYFAC |
Series-Dependent degree of linear regression for the polynomial fit line |
A2D_SDLINEMEAN |
Series-Dependent Mean average line |
A2D_SDLINEMOVA |
Series-Dependent Moving Average line |
A2D_SDLINESTDD |
Series-Dependent Standard Deviation line |
A2D_SERIES_LABELS_ON_CHART |
Series Labels to the right or left of Chart frame |
A2D_SHOW_BUBBLEGRID |
Show/Hide bubble grid |
A2D_SHOW_DATATEXT |
Show/Hide Data Text |
A2D_SHOW_DIVBIPOLAR |
Show/Hide line to divide a bipolar chart |
A2D_SHOW_ERRORBAR |
Show/Hide Error Bars |
A2D_SHOW_LEGEND |
Show/Hide Legend in a 2D chart |
A2D_SHOW_O1/O2 |
Show/Hide ordinal axis line and text headers |
A2D_SHOW_OFFSCALE_X/Y1/Y2/Y3/Y4 |
Show/Hide Off-Scale values on a numeric axis |
A2D_SHOW_QUADRANTS |
Show/Hide Quadrants in a Bubble Chart |
A2D_SHOW_TITLE_SERIES |
Show/Hide Series Title |
A2D_SHOW_TITLE_X/Y1/Y2/Y3/Y4 |
Show/Hide a numeric axis title |
A2D_SHOW_X/Y1/Y2/Y3/Y4 |
Show/Hide a numeric axis |
A2D_SHOW_ZL_X/Y1/Y2/Y3/Y4 |
Show/Hide zero line on a numeric axis |
A2D_SIDE_O1/O2 |
Side of chart ordinal axis labels are displayed |
A2D_SIDE_X/Y1/Y2/Y3/Y4 |
Side of chart numeric axis labels are displayed |
A2D_SIZE_ERRORBARS |
Size of Error Bars |
A2D_SPLITY_ND |
Assign series to Y1 or Y2 axis in a BiPolar Chart |
A2D_SPLITY_POSITION |
Split Y1/Y2 position in a BiPolar Chart |
A2D_SQUARE_LGND_ICONS |
Square Legend Icons |
A2D_STAGGER_O1/Y2 |
Stagger ordinal axis labels |
A2D_STAGGER_X/Y1/Y2/Y3/Y4/Z |
Stagger numeric axis labels |
A2D_SYMBOL_FORSERIES |
Symbol For Series in a 2D chart |
A2D_UNIFORM_QDRBORDERS |
Uniform Quantitative Data Representation (Riser) Border colors |
A2D_UNIFORM_QDRSHAPES |
Uniform Quantitative Data Representation (Riser) Shapes |
A2D_USE_MANUAL_PICTOGRAPH_SCALE |
Enable/Disable manual pictograph scaling |
A2D_USERLINE_AXIS |
User-Specified girdline on an axis |
A2D_USERLINE_SHOW |
User-Specified gridline show/hide |
A2D_USERLINE_VALUE |
User-Specified gridline location |
This attribute can be used to define additional curve-fits on a particular series. |
|||||||
Type: |
INT16 |
||||||
Valid Range: |
Use one or more of the following OR flags: |
||||||
#define |
Value |
Description |
|||||
BQUADRATICREGRESS |
1 |
Quadratic Regression |
|||||
BMODIFIEDHYPERBOLIC |
2 |
Modified Hyperbolic |
|||||
BRATIONAL |
4 |
Rational |
|||||
BLOGQUADRATIC |
8 |
Log Quadratic |
|||||
BHYPERBOLIC |
16 |
Hyperbolic |
|||||
BMODIFIEDEXPONENTIAL |
32 |
Modified Exponential |
|||||
Default: |
BQUADRATICREGRESS(1) |
||||||
Usage |
ObjectID |
SeriesID |
GroupID |
GraphTypes |
|||
Requirements: |
Yes, Identify a line object |
Yes |
No |
All |
|||
This attribute provides global control of automatic fitting. It will set or clear the auto-fit flag for legend text, data text, and ordinal and numeric axes labels. When auto-fit is enabled, the font size of these objects cannot be changed to a size that is larger than the relative location/size of the object and objects around it. When auto-fit is disabled, the font size can be set to any value allowing very large font sizes to overlap other objects in the graph. |
||||||
Type: |
BOOLEAN16 |
|||||
Valid Range: |
TRUE/FALSE |
|||||
TRUE= |
Auto-fit legend text and all labels. |
|||||
FALSE= |
Do not auto-fit legend text and labels |
|||||
Default: |
TRUE |
|||||
Notes: |
Enabling/disabling this attribute performs the same function as enabling or disabling all of the other auto-fit attributes individually (i.e., A2D_AUTOFIT_DATATEXT, A2D_AUTOFIT_LEGEND, A2D_AUTOFIT_O1, A2D_AUTOFIT_O2, A2D_AUTOFIT_X, A2D_AUTOFIT_Y1, A2D_AUTOFIT_Y2). |
|||||
Also See: |
A2D_AUTOFIT_LEGEND, A2D_AUTOFIT_O1/_O2/_X/_Y1_Y2 |
|||||
Usage |
ObjectID |
SeriesID |
GroupID |
GraphTypes |
||
Requirements: |
No |
No |
No |
All |
This attribute enables/disables autofitting of all data text. |
||||||
Type: |
BOOLEAN16 |
|||||
Valid Range: |
TRUE/FALSE |
|||||
TRUE= |
Auto-fit data text. |
|||||
FALSE= |
Do not auto-fit |
|||||
Default: |
TRUE |
|||||
Example: |
SetGraphAttrSI(gpGraph,gpSelItem, |
|||||
Also See: |
||||||
Usage |
ObjectID |
SeriesID |
GroupID |
GraphTypes |
||
Requirements: |
No |
No |
No |
All Except Pies |
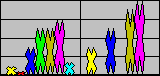
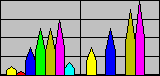
This attribute enables/disables automatic fitting of text inside the legend box. When autofitting is enabled, the font size of these objects cannot be changed to a size that is larger than the relative location/size of the object and objects around it. When autofitting is disabled, the font size can be set to any value allowing very large font sizes to overlap other objects. |
||||||
Type: |
BOOLEAN16 |
|||||
TRUE: |
|
|||||
FALSE: |
|
|||||
Valid Range: |
BOOLEAN16: TRUE/FALSE |
|||||
TRUE= |
Auto-fit text in the legend box. |
|||||
FALSE= |
Do not auto-fit text in the legend box. |
|||||
Default: |
TRUE |
|||||
Example: |
dFontSize = atoi (TempBuf); //User entered font size |
|||||
Notes: |
When this attribute is enabled, font size changes are ignored. The system continues to auto-fit the text regardless of A_FONTSIZE_VC settings. Your user interface should gray-out font size menu selections when this attribute is enabled. If you want to use this attribute to determine the approximate font size and then allow the user to modify point size within best-fit limits, include the following steps in your application program: |
|||||
1. |
Set A2D_AUTOFIT_LEGEND to TRUE |
|||||
2. |
Execute DryRunTheGraph |
|||||
3. |
Use GetGraphAttr to determine the font size that was used with auto-fit enabled |
|||||
4. |
Set A2D_AUTOFIT_LEGEND to FALSE |
|||||
Also See: |
||||||
Usage |
ObjectID |
SeriesID |
GroupID |
GraphTypes |
||
Requirements: |
No |
No |
No |
All except 3D Riser, Spectral, Gantt, Histogram, and Tables |
A2D_AUTOFIT_O1/O2/X/Y1/Y2
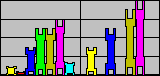
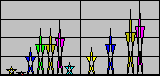
These attributes are used to automatically fit/size all text labels on an axis (O1, O2, X, Y1, or Y2). When autofitting is enabled (the default), the font size of these objects cannot be changed to a size that is larger than the relative location/size of the object and objects around it. When autofitting is disabled, the font size can be set to any value. It will allow very large font sizes to overlap other objects in the graph. |
||||||
Type: |
BOOLEAN16 |
|||||
Valid Range: |
TRUE/FALSE |
|||||
TRUE= |
Auto-fit labels. |
|||||
FALSE= |
Do not auto-fit. Align labels to axis; do not resize. |
|||||
Default: |
TRUE |
|||||
Example: |
// User entered font size |
|||||
Notes: |
When this attribute is enabled, font size changes are ignored. The system continues to auto-fit the text regardless of the setting of A_FONTSIZE_VC. Typically, your user interface should gray-out font size menu selections when this attribute is enabled. If you want to use this attribute to determine the approximate font size and then allow the user to modify point size within best-fit limits, include the following steps in your application program: |
|||||
1. |
Set A2D_AUTOFIT_... to TRUE |
|||||
2. |
Execute DryRunTheGraph |
|||||
3. |
Use GetGraphAttr to determine the font size that was used with auto-fit enabled |
|||||
4. |
Set A2D_AUTOFIT_... to FALSE |
|||||
Also See: |
||||||
Usage |
ObjectID |
SeriesID |
GroupID |
GraphTypes |
||
Requirements: |
No |
No |
No |
A2D_AUTOFIT_O1: Bar, Line, Area, Radar, Stock, Spectral, & Gantt. |
||
A2D_AUTOFIT_O2: Spectral Maps ONLY |
||||||
A2D_AUTOFIT_X: Scatter, Polar, Bubble, Histogram |
||||||
A2D_AUTOFIT_Y1: All except Pie, 3D Riser, 3D Scatter, & Table |
||||||
A2D_AUTOFIT_Y2: Dual-Axes and BI-Polar Only |
||||||
For bar graphs only, this attribute sets the spacing between groups of bars in a side-by-side bar graph. The larger the number, the greater the space between the bar groups; at 0 there is no space at all and all groups touch; at 100, the groups are as far apart as possible - all the bars are barely visible. |
||||||
Type: |
INT16 |
|||||
Valid Range: |
-1...100 |
|||||
-1= |
Bordering bars will overlap |
|||||
0 |
No space at all between groups; bordering bars will touch |
|||||
100= |
Groups are as far apart as possible - all bars are barely visible |
|||||
Default: |
0 (no space) |
|||||
Example: |
INT16 BarSpace = 25; //25% space between groups |
|||||
Notes: |
1. |
This attribute is interactive with A2D_BAR_RISER_WIDTH. If there is no space between the risers, space cannot be allocated between groups (i.e., the Group Spacing works by rearranging the space that is available between the Risers). |
||||
2. |
This attribute affects all O2D_RISER objects; it cannot be applied to an individual series or group. |
|||||
Also See: |
||||||
Usage |
ObjectID |
SeriesID |
GroupID |
GraphTypes |
||
Requirements: |
No |
No |
No |
Side-by-Side Bar Charts only |
||
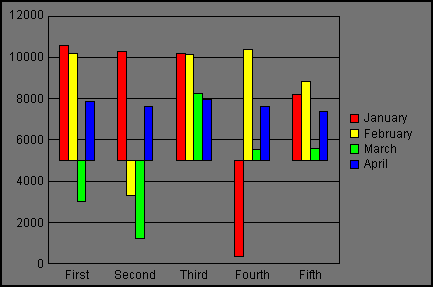
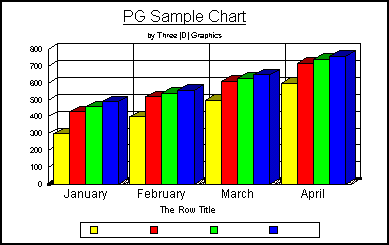
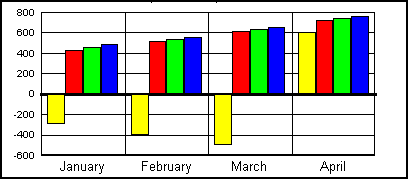
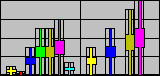
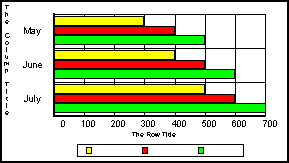
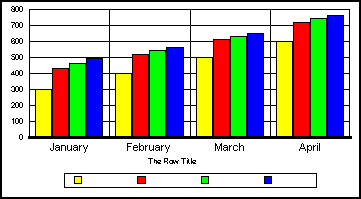
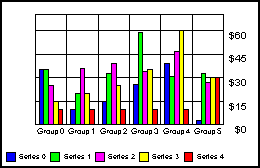
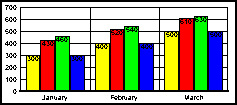
For bar graphs only, this attribute controls the width of all bars in a graph. It is defined as a percentage of the space available for each group of bars. A value of zero lets all the bars touch each other, with no space in between. A value of 99 will turn the bars into thin lines, with no area instance detectable. A value of 100 will draw NO BARS AT ALL. |
||||||
Type: |
INT16 |
|||||
Valid Range: |
1...100 |
|||||
0= |
The maximum bar width. Bars so thick they touch each other, with no space in between |
|||||
99= |
The minimum bar width. Bars are simply lines, with no area instance detectable |
|||||
100= |
No Bars |
|||||
Default: |
15 |
|||||
Example: |
INT16 BarSpace = 50; //25% space between groups |
|||||
|
||||||
Notes: |
1. |
This attribute interacts with A2D_BAR_GROUP_SPACING. Bar widths can only be adjusted as a percentage of what is left over after group spacing; i.e., if there is a lot of space between the groups, there will not be much visual difference between large and small values in BAR_RISER_WIDTH. |
||||
2. |
This attribute affects all O2D_RISER objects; it cannot be applied to an individual series or group. |
|||||
Also See: |
||||||
Usage |
ObjectID |
SeriesID |
GroupID |
GraphTypes |
||
Requirements: |
No |
No |
No |
Bar, Line, Area, Stock, Gantt, Histogram |
||
A2D_BASEVALUE_X/Y1/Y2/Y3/Y4
These attributes define the base value from which values are drawn on a numeric axis. All values greater than A2D_BASEVALUE_... drew up, all values less than A2D_BASEVALUE_... drew down from this point. |
|||||
Type: |
REAL64 |
||||
Valid Range: |
Any value within the chart's data range |
||||
Default: |
0.0 |
||||
Example: |
The following example shows how a chart is drawn when A2D_BASEVALUE_Y1 = 5000. |
||||
|
|||||
Usage |
ObjectID |
SeriesID |
GroupID |
GraphTypes |
|
Requirements: |
No |
No |
No |
ALL |
|
This attribute specifies the number of quadrant lines to draw on the X-axis in a bubble chart. |
|||||
Type: |
INT16 |
||||
Valid Range: |
Any INT16 |
||||
Default: |
2 |
||||
Example: |
INT16 Three = 3; |
||||
|
|||||
Also See: |
A2D_BUBBLEGRID_COUNT_Y, A2D_BUBBLEGRID_POSITION_X, A2D_BUBBLEGRID_POSITION_Y, A2D_SHOW_BUBBLEGRID |
||||
Usage |
ObjectID |
SeriesID |
GroupID |
GraphTypes |
|
Requirements: |
No |
No |
No |
Bubble |
|
This attribute specifies the number of quadrant lines to draw on the Y-axis in a bubble chart. |
|||||
Type: |
INT16 |
||||
Valid Range: |
Any INT16 |
||||
Default: |
2 |
||||
Example: |
INT16 Three = 3; |
||||
|
|||||
Also See: |
A2D_BUBBLEGRID_COUNT_X, A2D_BUBBLEGRID_POSITION_X, A2D_BUBBLEGRID_POSITION_Y, A2D_SHOW_BUBBLEGRID |
||||
Usage |
ObjectID |
SeriesID |
GroupID |
GraphTypes |
|
Requirements: |
No |
No |
No |
Bubble |
|
When A2D_BUBBLEGRID_COUNT_X is set to two, this attribute defines the bubble quadrant line position on the X-axis. A2D_BUBBLEGRID_POSITION_X represents the percentage of distance from the X-Minimum value to the X-Maximum value at which to draw the quadrant line. |
|||||
Type: |
INT16 |
||||
Valid Range: |
0...100 |
||||
Default: |
Zero |
||||
Example: |
INT16 Twenty=20; |
||||
|
|||||
Also See: |
A2D_BUBBLEGRID_COUNT_X, A2D_BUBBLEGRID_COUNT_Y, A2D_SHOW_BUBBLEGRID, A2D_BUBBLEGRID_POSITION_Y |
||||
Usage |
ObjectID |
SeriesID |
GroupID |
GraphTypes |
|
Requirements: |
No |
No |
No |
Bubble |
|
When A2D_BUBBLEGRID_COUNT_Y is set to two, this attribute defines the bubble quadrant line position on the Y-axis. A2D_BUBBLEGRID_POSITION_Y represents the percentage of distance from the Y-Minimum value to the Y-Maximum value at which to draw the quadrant line. |
|||||
Type: |
INT16 |
||||
Valid Range: |
0...100 |
||||
Default: |
Zero |
||||
Example: |
INT16 Sixty=60; |
||||
|
|||||
Also See: |
A2D_BUBBLEGRID_POSITION_X, A2D_BUBBLEGRID_COUNT_X, A2D_BUBBLEGRID_COUNT_Y, A2D_SHOW_BUBBLEGRID |
||||
Usage |
ObjectID |
SeriesID |
GroupID |
GraphTypes |
|
Requirements: |
No |
No |
No |
Bubble |
|
This attribute determines whether the risers in a bar graph will be colored by series or by group. Normally, risers are colored by series. On a 2D graph that shows six groups with three bars each (6 groups of 3 risers sitting on the X-axis), the first bar of each group will have the same color, the second of each will be the same color, etc. This is the normal, default method of coloring risers in a bar graph. When this attribute is set to FALSE, all risers in a single group will use the same color and each group has its individual color. |
||||||
Type: |
BOOLEAN16 |
|||||
Valid Range: |
TRUE/FALSE |
|||||
TRUE= |
Color by series (the standard). |
|||||
FALSE= |
Color by group (the special case). |
|||||
Default: |
TRUE |
|||||
Example: |
SetGraphAttr(gpGraph,GRAPH_LAYER, |
|||||
|
||||||
Notes: |
1. |
The legend markers in the legend area typically associate legend text with a series of risers in the graph (i.e., each legend marker is the same color as a series in the graph). When this attribute is FALSE, it effectively invalidates the information in the legend area. |
||||
2. |
This attribute affects all O2D_RISER objects; it cannot be applied to a single series or group. |
|||||
3. |
Use A_AREACOLOR_RGB to specify the color of risers in the series or group. |
|||||
Also See: |
||||||
Usage |
ObjectID |
SeriesID |
GroupID |
GraphTypes |
||
Requirements: |
No |
No |
No |
All except Table |
||
This attribute enables/disables the display of the O2D_CONNECT_STACKLINE object. This object is a connecting line between a series/group in a stacked bar chart. For example, imagine you have a STACKED BAR CHART with 4 series and 3 Groups. These objects are the lines that draw between the stacks. These lines draw from the top of Series "X" in Group "N" to the top of the same series in Group "N+1". |
||||||
Type: |
BOOLEAN16 |
|||||
Valid Range: |
TRUE/FALSE |
|||||
TRUE= |
Display O2D_CONNECT_STACKLINE |
|||||
FALSE= |
Do not display O2D_CONNECT_STACKLINE |
|||||
Default: |
FALSE |
|||||
Example: |
BOOLEAN16 bTRUE = TRUE; |
|||||
|
||||||
Usage |
ObjectID |
SeriesID |
GroupID |
GraphTypes |
||
Requirements: |
No |
No |
No |
Bar |
||
This attribute can be used to lock the color of all curve lines to their associated series color or to allow the curves to carry their own individual color assignment. |
||||||
Type: |
BOOLEAN16 |
|||||
Valid Range: |
TRUE/FALSE |
|||||
TRUE= |
Curve will be colored the same as the area portion of the series from which it is derived. |
|||||
FALSE= |
Curve will initially be the same color as the series, but it can be colored independently of the series area. |
|||||
Default: |
TRUE |
|||||
Example: |
BOOLEAN16 bFALSE = FALSE; |
|||||
|
||||||
Notes: |
After curve colors has been unlocked from the associated series, it can be changed to a different color by the A_LINECOLOR_RGB attribute. |
|||||
Also See: |
||||||
Usage |
ObjectID |
SeriesID |
GroupID |
GraphTypes |
||
Requirements: |
No |
No |
No |
Bar, Line, Area, Scatter, Polar, Radar, Bubble, Stock, Gantt, and Histogram |
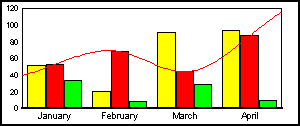
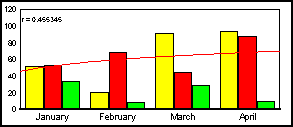
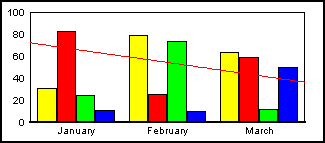
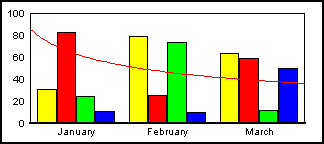
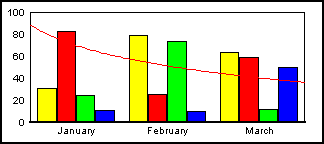
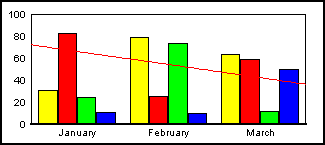
This attribute specifies the number of data points/groups to use when generating a moving average curve. It affects all moving average lines objects (O2D_MOVAVGLINE) in the graph. |
||||||
Type: |
INT16 |
|||||
Valid Range: |
0...number of groups in graph |
|||||
0= |
No points and no curve is drawn |
|||||
1= |
Only one point will be used to generate the moving average curve. Effectively no curve is drawn |
|||||
2... |
Specifies the number of points/groups across which the moving average curve (scientific or financial type) is drawn |
|||||
Default: |
Number of groups in graph |
|||||
Example: |
INT16 three = 3; |
|||||
|
||||||
Notes: |
1. |
If you specify a number of points greater than the number of groups in the graph, the line is not drawn. |
||||
2. |
Use A2D_SDLINEMOVA to enable/draw this line. Use A2D_SCIMOVAVG to identify the moving averaging line type (scientific or financial). |
|||||
Also See: |
||||||
Usage |
ObjectID |
SeriesID |
GroupID |
GraphTypes |
||
Requirements: |
No |
No |
No |
Bar, Line, Area, Scatter, Polar, Radar, Bubble, Stock, Gantt, and Histogram |
||
This attribute specifies number of points to use to generate a smooth curve. It affects the appearance of all series associated lines (e.g., O2D_LINR_EXP, O2D_LINR_LINE, O2D_CURVE, etc.) |
|||||
Type: |
INT16 |
||||
Valid Range: |
any positive INT16 value. Larger values draw a smoother curve. |
||||
Default: |
100 |
||||
Example: |
//set number of points to 200 |
||||
|
|||||
Notes: |
If you set this attribute to a value less than zero, the system will automatically reset to the default value (100). |
||||
Also See: |
|||||
Usage |
ObjectID |
SeriesID |
GroupID |
GraphTypes |
|
Requirements: |
No |
No |
No |
Bar, Line, Area, Scatter, Polar, Radar, Bubble, Stock, Gantt, and Histogram |
|
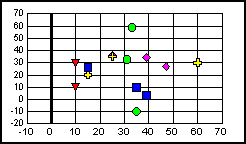
This attribute specifies the number of values that the graphics engine will request from a data source (e.g., spreadsheet) to define a data point on a 2D graph. When more than one value defines a data point, this attribute also determines the usage (or interpretation) of each value. The number of values that can be used to define each data point and the interpretation of each value depends on the graph type. As an example, if this attribute is set to "1", the system will expect two values to define each data point. If the graph type is a 2D Bar, Line or Area graph, the second value is interpreted as a data label. If the graph type is a 2D X,Y Scatter graph, the first value is interpreted as the X-Axis value and the second value is interpreted as the Y-Axis value. |
||||||
WARNING! |
If the selected data format is not compatible with the graph type selected by A_GRAPH_PRESET, the resulting graph (if any) will not accurately reflect the data. Typically, only the graph background and frame are drawn when A2D_DATAFORMAT is not set properly. |
|||||
Type: |
INT16 |
|||||
Valid Range: |
Depends on the graph type set by A_GRAPH_PRESET. If nMajorType is set to TDG_GRAPH_3D, see A3D_DATAFORMAT for allowable values. If nMajorType is set to TDG_GRAPH_AREA, TDG_GRAPH_BARS, TDG_GRAPH_LINES, or TDG_GRAPH_TABLE, use one of these values: |
|||||
INT16 |
A2D_DATAFORMAT+1 value(s) is/are intrepreted as: |
|||||
0 |
VALUE |
|||||
1 |
VALUE, LABEL |
|||||
2 |
VALUE, LABEL, VALUE_ERR_LOW |
|||||
3 |
VALUE, LABEL, VALUE_ERR_LOW, VALUE_ERR_HIGH |
|||||
5 |
VALUE, VALUE_ERR_LOW, VALUE_ERR_HIGH |
|||||
9 |
VALUE, LABEL, VALUE_ERR_HIGH |
|||||
If nMajorType is set to TDG_GRAPH_PIES, zero is the only allowable value for A2D_DATAFORMAT. |
||||||
INT16 |
A2D_DATAFORMAT+1 value(s) is/are intrepreted as: |
|||||
0 |
VALUE |
|||||
If nMajorType is set to TDG_GRAPH_SPECIAL and nMinorType is set to SPECIAL_HISTOGRAM, zero is the only allowable value for A2D_DATAFORMAT. |
||||||
INT16 |
A2D_DATAFORMAT+1 value(s) is/are intrepreted as: |
|||||
0 |
VALUE |
|||||
If nMajorType is set to TDG_GRAPH_SPECIAL and nMinorType is set to SPECIAL_SPECTRAL, use one of the following values: |
||||||
INT16 |
A2D_DATAFORMAT+1 value(s) is/are intrepreted as: |
|||||
0 |
VALUE |
|||||
1 |
VALUE, LABEL |
|||||
If nMajorType is set to TDG_GRAPH_SPECIAL and nMinorType is set to SPECIAL_POLAR, one is the only allowable value for A2D_DATAFORMAT. |
||||||
INT16 |
A2D_DATAFORMAT+1 value(s) is/are intrepreted as: |
|||||
1 |
VALUE_X, VALUE_Y |
|||||
If nMajorType is set to TDG_GRAPH_SPECIAL and nMinorType is set to SPECIAL_SCATTER, SPECIAL_SCATTER_DUALY, or SPECIAL_STEMLEAF, use one of these values: |
||||||
INT16 |
A2D_DATAFORMAT+1 value(s) is/are intrepreted as: |
|||||
1 |
VALUE_X, VALUE_Y |
|||||
2 |
VALUE_X, VALUE_Y, LABEL |
|||||
3 |
VALUE_X, VALUE_Y, LABEL, VALUE_ERR_LOW |
|||||
4 |
VALUE_X, VALUE_Y, LABEL, VALUE_ERR_LOW, VALUE_ERR_HIGH |
|||||
6 |
VALUE_X, VALUE_Y, VALUE_ERR_LOW, VALUE_ERR_HIGH |
|||||
9 |
VALUE_X, VALUE_Y, VALUE_ERR_LOW |
|||||
10 |
VALUE_X, VALUE_Y, LABEL, VALUE_ERR_HIGH |
|||||
If nMajorType is set to TDG_GRAPH_SPECIAL and nMinorType is set to SPECIAL_HILO, SPECIAL_HILO_DUALY, or SPECIAL_JAPANESE_STOCK, use this value: |
||||||
INT16 |
A2D_DATAFORMAT+1 value(s) is/are intrepreted as: |
|||||
18 |
VALUE_HIGH, VALUE_LOW, VALUE_OPEN, VALUE_CLOSE, VALUE_METRIC1, VALUE_METRIC2, VALUE_METRIC3 |
|||||
If nMajorType is set to TDG_GRAPH_SPECIAL and nMinorType is set to SPECIAL_RADAR_ABSOLUTE_LINE, SPECIAL_RADAR_STACKED_AREA, or SPECIAL_RADAR_ABSOLUTE_AREA, use this value: |
||||||
INT16 |
A2D_DATAFORMAT+1 value(s) is/are intrepreted as: |
|||||
0 |
VALUE |
|||||
If nMajorType is set to TDG_GRAPH_SPECIAL and nMinorType is set to SPECIAL_BUBBLE, use one of these values: |
||||||
INT16 |
A2D_DATAFORMAT+1 value(s) is/are intrepreted as: |
|||||
2 |
VALUE_X, VALUE_Y, VALUE_Z |
|||||
3 |
VALUE_X, VALUE_Y, VALUE_Z, LABEL |
|||||
If nMajorType is set to TDG_GRAPH_SPECIAL and nMinorType is set to SPECIAL_GANTT, use one of these values: |
||||||
INT16 |
A2D_DATAFORMAT+1 value(s) is/are intrepreted as: |
|||||
1 |
VALUE, VALUE |
|||||
2 |
VALUE, VALUE, LABEL |
|||||
Default: |
0 (zero) |
|||||
Notes: |
1. |
A2D_DATAFORMAT is an extremely important attribute. If it is not set properly when the graph type is loaded or changed, the results will be unpredictable. Great care must be taken to ensure that the actual arrangement of data that is input to the graph matches the setting of A2D_DATAFORMAT. |
||||
2. |
Since the data format selection is different for each graph type, a graph type selection (A_GRAPH_PRESET) should also include an A2D_DATAFORMAT selection. |
|||||
3. |
Use A2D_SHOW_DATATEXT to show the values and labels associated with a data point on a 2D graph. |
|||||
4. |
Use A3D_DATAFORMAT to define the format of data that input to a 3D graph. |
|||||
Also See: |
||||||
Usage |
ObjectID |
SeriesID |
GroupID |
GraphTypes |
||
Requirements: |
No |
No |
No |
All 2D |
||
This attribute specifies the arrangement (by row or by column) of data values in the data source (e.g., spreadsheet). When TRUE, the system reads riser values as if they were arranged in columns. When FALSE, the system requires that the data for each riser be arranged in rows (the user can't specify the arrangement of data). For example, consider a High/Low/Open/Close graph with four values for each riser. The default method arranges riser values by row as shown in the following table: |
||||||||||
High |
Low |
Open |
Close |
|||||||
Riser 1 |
292.22 |
287.38 |
289.22 |
290.23 |
||||||
Riser 2 |
277.30 |
274.66 |
275.53 |
276.23 |
||||||
The alternate method arranges riser values by column as shown in the following table. |
||||||||||
Riser 2 |
Riser 2 |
|||||||||
High |
292.22 |
277.30 |
||||||||
Low |
287.38 |
274.66 |
||||||||
Open |
289.22 |
275.53 |
||||||||
Close |
290.23 |
276.23 |
||||||||
If this arrangement is used, set A2D_DATAFORMAT_VERT to TRUE. |
||||||||||
Type: |
BOOLEAN16 |
|||||||||
Valid Range: |
TRUE/FALSE |
|||||||||
TRUE= |
Read vertically: riser data is listed by column |
|||||||||
FALSE= |
Read horizontally: usual method of listing riser data by row |
|||||||||
Default: |
FALSE |
|||||||||
Example: |
BOOLEAN16 bValue = FALSE; |
|||||||||
Also See: |
||||||||||
Usage |
ObjectID |
SeriesID |
GroupID |
GraphTypes |
||||||
Requirements: |
No |
No |
No |
All |
||||||
This attribute is used to specify the angle (in degrees) at which a 3-D effect is applied to a 2-D graph by the A2D_DEPTH_MODE attribute. |
|||||
Type: |
INT16 |
||||
Valid Range: |
0...360 degrees |
||||
Default: |
45 degrees |
||||
Example: |
//3D Effect |
||||
Notes: |
The A2D_DEPTH_MODE attribute must be enabled (set to DEPTHMODE_ISOSHEAR) in order for this attribute to have any effect on the graph. |
||||
Also See: |
|||||
Usage |
ObjectID |
SeriesID |
GroupID |
GraphTypes |
|
Requirements: |
No |
No |
No |
Bar, Line, Area, Scatter, Bubble, Stock, Gantt, and Histogram |
|
This attribute is used to specify the scale of the base unit for chart depth when a 3-D effect is applied to a 2-D graph by the A2D_DEPTH_MODE attribute. |
|||||
Type: |
INT16 |
||||
Valid Range: |
0...100 |
||||
Default: |
100 |
||||
Example: |
//3D Effect |
||||
Notes: |
The A2D_DEPTH_MODE attribute must be enabled (set to DEPTHMODE_ISOSHEAR) in order for this attribute to have any effect on the graph. This attribute has not effect in pie charts. |
||||
Also See: |
|||||
Usage |
ObjectID |
SeriesID |
GroupID |
GraphTypes |
|
Requirements: |
No |
No |
No |
Bar, Line, Area, Scatter, Bubble, Stock, Gantt, and Histogram |
|
This attribute can be used to give a 2-D graph a 3-dimensional appearance.. |
|||||||
Type: |
INT16 |
||||||
Valid Range: |
One of the following #defines: |
||||||
#define |
Value |
Description |
|||||
DEPTHMODE_NONE |
0 |
Normal chart. |
|||||
DEPTHMODE_ISOSHEAR |
1 |
Fake 3D effect on risers |
|||||
DEPTHMODE_TRUE3D |
2 |
True 3D effect on risers |
|||||
Default: |
0 (DEPTHMODE_NONE) |
||||||
Example: |
INT16 n3D = DEPTHMODE_ISOSHEAR; |
||||||
|
|||||||
Also See: |
|||||||
Usage |
ObjectID |
SeriesID |
GroupID |
GraphTypes |
|||
Requirements: |
No |
No |
No |
Bar, Line, Area, Scatter, Bubble, Stock, Gantt, and Histogram |
|||
A2D_DIRECTION_X/Y1/Y2/Y3/Y4/Z
These attributes are used to change the direction of an axis. When the attribute is FALSE, axis values ascend normally. When the attribute is TRUE, axis values are reversed. Note that these attributes also reverse the order of the axis labels and changes all data-related objects (e.g., markers) from their previous state. |
||||||
Type: |
BOOLEAN16 |
|||||
Valid Range: |
TRUE/FALSE |
|||||
TRUE= |
Descending values (scale labels are reversed in order). |
|||||
FALSE= |
Ascending values (normal axis) |
|||||
Default: |
FALSE |
|||||
Example: |
SetGraphAttr(gpGraph,GRAPH_LAYER, |
|||||
|
||||||
Also See: |
A2D_SIDE_X/_Y1/_Y2/_Y3/_Y4 |
|||||
Usage |
ObjectID |
SeriesID |
GroupID |
GraphTypes |
||
Requirements: |
No |
No |
No |
A2D_DIRECTION_X: |
||
Scatter, Polar, Bubble, & Histogram |
||||||
A2D_DIRECTION_Y1: |
||||||
All except Pie, 3D Riser, 3D Scatter, and Table |
||||||
A2D_DIRECTION_Y2: |
||||||
Dual-Axes and BI-Polar Only |
||||||
A2D_DIRECTION_Y3/Y4: |
||||||
Bar, Line, Area, Stock, & Scatter |
||||||
A2D_DIRECTION_Z: |
||||||
3D Scatter Charts Only |
||||||
A2D_EXCLUDE_ZERO_X/Y1/Y2/Y3/Y4/Z
These attributes enable/disable the re-scaling of a graph based on the range of data that is supplied to it. When automatic scaling is selected with A2D_SCALE_..., the system automatically re-scales the graph based on the range of data it is asked to chart. When A2D_EXCLUDE_ZERO_... is disabled (FALSE), the scale origin is always zero. When A2D_EXCLUDE_ZERO_... is enabled (TRUE), the scale origin is based on the range of values supplied to the graph. |
||||||
Type: |
BOOLEAN16 |
|||||
Valid Range: |
TRUE/FALSE |
|||||
TRUE= |
Re-scale the graph based on range of data |
|||||
FALSE= |
Always re-scale the graph from zero |
|||||
Default: |
FALSE |
|||||
Example: |
BOOLEAN bTRUE = TRUE; |
|||||
|
||||||
Also See: |
A2D_SCALE_X/_Y1/_Y2/_Y3/_Y4 |
|||||
Usage |
ObjectID |
SeriesID |
GroupID |
GraphTypes |
||
Requirements: |
No |
No |
No |
A2D_EXCLUDE_ZERO_X: |
||
Scatter, Polar, Bubble, & Histogram |
||||||
A2D_EXCLUDE_ZERO_Y1: |
||||||
All except Pie, 3D Riser, 3D Scatter, and Table |
||||||
A2D_EXCLUDE_ZERO_Y2: |
||||||
Dual-Axes and BI-Polar Only |
||||||
A2D_EXCLUDE_ZERO_Y3/Y4: |
||||||
Bar, Line, Area, Stock, & Scatter |
||||||
A2D_EXCLUDE_ZERO_Z: |
||||||
3D Scatter Charts Only |
||||||
This attribute selects one of the predefined formats for values in the formula and correction coefficient strings that are displayed in association with series-dependent (SDLINELINR...) lines. Use A2D_FORMAT_SDLINE_ADV if you want to define a custom format string. |
||||||||||
Type: |
typedef struct _TDG_SerDepINT16 { |
|||||||||
Valid Range: |
nSeriesID: Specifies the series to which this data format applies. |
|||||||||
nValue: 1...55 selects one of the following formats. Use a value greater than 60 to trigger the RealToString Callback Function. |
||||||||||
1= |
General |
19= |
0.000E+00 |
37= |
#,##0M |
|||||
2= |
0 |
20= |
0.0e+00 |
38= |
#,##0.00M |
|||||
3= |
0.0 |
21= |
0.00e+00 |
39= |
M0 |
|||||
4= |
0.00 |
22= |
0.000e+00 |
40= |
M0.00 |
|||||
5= |
#,##0 |
23= |
0K |
41= |
M#,##0 |
|||||
6= |
#,##0.00 |
24= |
0.00K |
42= |
M#,##0.00 |
|||||
7= |
$0 |
25= |
#,##0K |
43= |
$0M |
|||||
8= |
$0.00 |
26= |
#,##0.00K |
44= |
$0.00M |
|||||
9= |
$#,##0 |
27= |
K0 |
45= |
$#,##0M |
|||||
10= |
$#,##0.00 |
28= |
K0.00 |
46= |
$#,##0.00M |
|||||
11= |
0% |
29= |
K#,##0 |
47= |
hh:mm AM/PM |
|||||
12= |
0.0% |
30= |
K#,##0.00 |
48= |
hh:mm:ss AM/PM |
|||||
13= |
0.00% |
31= |
$0K |
49= |
HH:mm |
|||||
14= |
%0 |
32= |
$0.00K |
50= |
LOCALE_SSHORTDATE |
|||||
15= |
%0.0 |
33= |
$#,##0K |
51= |
LOCALE_SLONGDATE |
|||||
16= |
%0.00 |
34= |
$#,##0.00K |
52= |
MMM yy or yy MMM |
|||||
17= |
0.0E+00 |
35= |
0M |
53= |
MMM dd yy, dd MMM yy, or yy MMM dd |
|||||
18= |
0.00E+00 |
36= |
0.00M |
54= |
MMM dd, dd MMM |
|||||
55= |
MMM dd yy hh:mm AM/PM, dd MMM yy HH:mm, or |
|||||||||
yy MMM dd HH:mm |
||||||||||
Default: |
19 (0.000E+00 (e.g., 1,000,000 = 1.000E+6)) |
|||||||||
Example: |
struct _TDG_SerDepINT16 whichFormat; |
|||||||||
Notes: |
1. |
The formula/correction coefficient text must be enabled with A2D_SDLINELINR_CORR or A2D_SDLINELINR_FORMULA. |
||||||||
2. |
The LOCALE_xxxxxxx values are Win32 locale constants which can be queried by calling the Win32 API: GetLocaleInfo. Please see Win32 API Doc. |
|||||||||
Also See: |
A2D_FORMAT_SDLINE_ADV, A2D_SDLINELINR_CORR, A2D_SDLINELINR_FORMULA, A2D_LOCATE_LINR_TEXT |
|||||||||
Usage |
ObjectID |
SeriesID |
GroupID |
GraphTypes |
||||||
Requirements: |
No |
Yes, must be set in nSeriesID |
No |
Bar, Line, Area, Scatter, Bubble, Stock, Gantt, and Histogram |
||||||
This attribute can be used to define a custom format string for values in the formula and correction coefficient strings. Use A2D_FORMAT_SDLINE to select one of the predefined formats. |
|||||
Type: |
typedef struct _AdvFormatStruct { |
||||
Valid Range: |
See the AdvFormatStruct in Appendix A for information about how to fill in the fields in this data structure to define the advanced number format. |
||||
Default: |
None |
||||
Notes: |
Use the InitAdvFormat() API to initialize the AdvFormatStruct before you apply this attribute. |
||||
Also See: |
A2D_FORMAT_SDLINE, InitAdvFormat() |
||||
Usage |
ObjectID |
SeriesID |
GroupID |
GraphTypes |
|
Requirements: |
No |
Yes, must be set in nSeriesID |
No |
Bar, Line, Area, Scatter, Bubble, Stock, Gantt, and Histogram |
|
A2D_FORMAT_X/Y1/Y2/Y3/Y4/Z
These attributes select one of the predefined formats for the data labels on a numeric axis. Use one of the A2D_FORMAT_..._ADV attributes to define a custom format string. |
||||||||||
Type: |
INT16 |
|||||||||
Valid Range: |
1...55 selects one of the following formats. Use a value greater than 60 to trigger the RealToString Callback Function. |
|||||||||
1= |
General |
19= |
0.000E+00 |
37= |
#,##0M |
|||||
2= |
0 |
20= |
0.0e+00 |
38= |
#,##0.00M |
|||||
3= |
0.0 |
21= |
0.00e+00 |
39= |
M0 |
|||||
4= |
0.00 |
22= |
0.000e+00 |
40= |
M0.00 |
|||||
5= |
#,##0 |
23= |
0K |
41= |
M#,##0 |
|||||
6= |
#,##0.00 |
24= |
0.00K |
42= |
M#,##0.00 |
|||||
7= |
$0 |
25= |
#,##0K |
43= |
$0M |
|||||
8= |
$0.00 |
26= |
#,##0.00K |
44= |
$0.00M |
|||||
9= |
$#,##0 |
27= |
K0 |
45= |
$#,##0M |
|||||
10= |
$#,##0.00 |
28= |
K0.00 |
46= |
$#,##0.00M |
|||||
11= |
0% |
29= |
K#,##0 |
47= |
hh:mm AM/PM |
|||||
12= |
0.0% |
30= |
K#,##0.00 |
48= |
hh:mm:ss AM/PM |
|||||
13= |
0.00% |
31= |
$0K |
49= |
HH:mm |
|||||
14= |
%0 |
32= |
$0.00K |
50= |
LOCALE_SSHORTDATE |
|||||
15= |
%0.0 |
33= |
$#,##0K |
51= |
LOCALE_SLONGDATE |
|||||
16= |
%0.00 |
34= |
$#,##0.00K |
52= |
MMM yy or yy MMM |
|||||
17= |
0.0E+00 |
35= |
0M |
53= |
MMM dd yy, dd MMM yy, or yy MMM dd |
|||||
18= |
0.00E+00 |
36= |
0.00M |
54= |
MMM dd, dd MMM |
|||||
55= |
MMM dd yy hh:mm AM/PM, dd MMM yy HH:mm, or |
|||||||||
yy MMM dd HH:mm |
||||||||||
Default: |
1 (General) |
|||||||||
Example: |
/* Select $ format for Y1 axis labels */ |
|||||||||
|
||||||||||
Also See: |
||||||||||
Usage |
ObjectID |
SeriesID |
GroupID |
GraphTypes |
||||||
Requirements: |
No |
No |
No |
A2D_FORMAT_X: |
||||||
Scatter, Polar, Bubble, & Histogram |
||||||||||
A2D_FORMAT_Y1: |
||||||||||
All except Pie, 3D Riser, 3D Scatter, and Table |
||||||||||
A2D_FORMAT_Y2: |
||||||||||
Dual-Axes and BI-Polar Only |
||||||||||
A2D_FORMAT_Y3/Y4: |
||||||||||
Bar, Line, Area, Stock, & Scatter |
||||||||||
A2D_FORMAT_Z: |
||||||||||
3D Scatter Charts Only |
||||||||||
A2D_FORMAT_X/Y1/Y2/Y3/Y4/Z_ADV
This attribute defines a custom format string for data labels on a numeric axis. Use an A2D_FORMAT_... attribute to select one of the predefined formats. |
|||||
Type: |
typedef struct _AdvFormatStruct { |
||||
Valid Range: |
See AdvFormatStruct in Appendix A for information about how to fill in the fields in this data structure to define the custom number format. |
||||
Default: |
None |
||||
Notes: |
Use the InitAdvFormat() API to initialize the AdvFormatStruct before you apply this attribute. |
||||
Also See: |
A2D_FORMAT_..., InitAdvFormat() |
||||
Usage |
ObjectID |
SeriesID |
GroupID |
GraphTypes |
|
Requirements: |
No |
No |
No |
A2D_FORMAT_X_ADV: |
|
Scatter, Polar, Bubble, & Histogram |
|||||
A2D_FORMAT_Y1_ADV: |
|||||
All except Pie, 3D Riser, 3D Scatter, and Table |
|||||
A2D_FORMAT_Y2_ADV: |
|||||
Dual-Axes and BI-Polar Only |
|||||
A2D_FORMAT_Y3/Y4_ADV: |
|||||
Bar, Line, Area, Stock, & Scatter |
|||||
A2D_FORMAT_Z_ADV: |
|||||
3D Scatter Charts Only |
|||||
A2D_FORMATDTXT_X/Y1/Y2/Y3/Y4
This attribute selects one of the predefined formats for the data text on a numeric axis. Use one of the A2D_FORMATDTXT_..._ADV attributes to define a custom format string. |
|||||
Type: |
INT16 |
||||
Valid Range: |
See A2D_FORMAT_... |
||||
Default: |
1 (General) |
||||
Example: |
/* Select $0K format for Y1 axis data text */ |
||||
|
|||||
Notes: |
These attributes affect values displayed on risers by A2D_SHOW_DATATEXT (not labels along the edge of the axis). The A2D_PLACE_... attributes control the placement of this data text on the risers. |
||||
Also See: |
|||||
Usage |
ObjectID |
SeriesID |
GroupID |
GraphTypes |
|
Requirements: |
No |
No |
No |
A2D_FORMATDTXT_X: |
|
Scatter, Polar, Bubble, & Histogram |
|||||
A2D_FORMATDTXT_Y1: |
|||||
All except Pie, 3D Riser, 3D Scatter, and Table |
|||||
A2D_FORMATDTXT_Y2: |
|||||
Dual-Axes and BI-Polar Only |
|||||
A2D_FORMATDTXT_Y3/Y4: |
|||||
Bar, Line, Area, Stock, & Scatter |
|||||
A2D_FORMATDTXT_X/Y1/Y2/Y3/Y4_ADV
These attributes define a custom format string for data text on a numeric axis. Use A2D_FORMATDTXT_... if you want to select one of the predefined formats. |
||||||
Type: |
typedef struct _AdvFormatStruct { |
|||||
Valid Range: |
See AdvFormatStruct in Appendix A for information about how to fill in the fields in this data structure to define the custom number format. |
|||||
Default: |
None |
|||||
Notes: |
1. |
These attributes affect values displayed on risers by A2D_SHOW_DATATEXT (not labels along the edge of the axis). The A2D_PLACE_... attributes control the placement of this data text on the risers. |
||||
2. |
Use the InitAdvFormat() API to initialize the AdvFormatStruct before you apply this attribute. |
|||||
Also See: |
A2D_FORMATDTXT_... InitAdvFormat() |
|||||
Usage |
ObjectID |
SeriesID |
GroupID |
GraphTypes |
||
Requirements: |
No |
No |
No |
A2D_FORMATDTXT_X_ADV: |
||
Scatter, Polar, Bubble, & Histogram |
||||||
A2D_FORMATDTXT_Y1_ADV: |
||||||
All except Pie, 3D Riser, 3D Scatter, & Table |
||||||
A2D_FORMATDTXT_Y2_ADV: |
||||||
Dual-Axes & BI-Polar Only |
||||||
A2D_FORMATDTXT_Y3/Y4_ADV: |
||||||
Bar, Line, Area, Stock, & Scatter |
||||||
A2D_GRID_STEP_X/Y1/Y2/Y3/Y4/Z
These attributes provide an alternate way of setting numeric axis gridlines and labels. Just specify a step value and the axis will start at its minimum and draw a label/gridline every specified step value until it hits the maximum |
|||||
Type: |
typedef struct _TDG_GridStepValues { |
||||
Valid Range: |
See the TDG_GridStepValuesInfo structure in Appendix A. |
||||
Default: |
None |
||||
Also See: |
|||||
Usage |
ObjectID |
SeriesID |
GroupID |
GraphTypes |
|
Requirements: |
No |
No |
No |
A2D_GRID_STEP_X: |
|
Scatter, Polar, Bubble, & Histogram |
|||||
A2D_GRID_STEP_Y1: |
|||||
All except Pie, 3D Riser, 3D Scatter, and Table |
|||||
A2D_GRID_STEP_Y2: |
|||||
Dual-Axes and BI-Polar Only |
|||||
A2D_GRID_STEP_Y3/Y4: |
|||||
Bar, Line, Area, Stock, & Scatter |
|||||
A2D_GRID_STEP_Z: |
|||||
3D Scatter Charts Only |
|||||
When this attribute is set to TRUE, gridlines are drawn on TOP of the rest of the chart (so all risers and markers are drawn below the gridlines). |
||||||
Type: |
BOOLEAN16 |
|||||
Valid Range: |
True/False |
|||||
TRUE= |
Draw gridlines on top of the rest of the chart |
|||||
FALSE= |
Draw gridlines normally |
|||||
Default: |
FALSE |
|||||
Usage |
ObjectID |
SeriesID |
GroupID |
GraphTypes |
||
Requirements: |
No |
No |
No |
All 2D |
||
A2D_GRIDLINES_X/Y1/Y2/Y3/Y4/Z
These attributes define how gridlines on a numeric axis are imaged. It affects numeric axis labels and major and minor gridlines. |
|||||
Type: |
typedef struct _TDG_GridLines { |
||||
Valid Range: |
See the TDG_GridLinesInfo data structure in Appendix A |
||||
Default: |
bIsLog = FALSE |
||||
bMajorHashManual = FALSE |
|||||
bMinorHashManual = FALSE |
|||||
nMajorHashStyle = X=TickSpan, Y1/Y2/Y3/Y4/Z=Grid |
|||||
nMinorHashStyle = X=TickOut, Y1/Y2/Y3/Y4/Z=None |
|||||
nMajorHashCount = 0 |
|||||
nMinorHashCount = 0 |
|||||
Notes: |
The linear/logarithmic scale set by bIsLog can also be set by A2D_LOG_.... |
||||
Also See: |
A2D_LOG_... |
||||
Usage |
ObjectID |
SeriesID |
GroupID |
GraphTypes |
|
Requirements: |
No |
No |
No |
A2D_GRIDLINES_X: |
|
Scatter, Polar, Bubble, & Histogram |
|||||
A2D_GRIDLINES_Y1: |
|||||
All except Pie, 3D Riser, 3D Scatter, and Table |
|||||
A2D_GRIDLINES_Y2: |
|||||
Dual-Axes and BI-Polar Only |
|||||
A2D_GRIDLINES_Y3/Y4: |
|||||
Bar, Line, Area, Stock, & Scatter |
|||||
A2D_GRIDLINES_Z: |
|||||
3D Scatter Charts Only |
This attribute controls the appearance of primary ordinal axis (O1) gridlines (i.e., lines attached to a text-based axis, like the "bottom" axis of a bar graph). Since these gridlines are not based on a numeric scale, they have fewer possible controls than numeric-based gridlines. However, you may define major, minor, and super gridlines that draw on the Ordinal (Group) Axes. Major and minor gridlines are normally drawn "between" groups or "at groups". Super gridlines are normally drawn "every so many groups". So, for example, you could do one super gridline for every 10 regular gridlines as an example. Supers are to Majors as Majors are to Minors. |
|||||
Type: |
typedef struct _TDG_GridLinesOrd { |
||||
Valid Range: |
See the TDG_GridLinesOrdInfo data structure in Appendix A |
||||
Default: |
nMajorHashStyle: 1 |
||||
nMinorHashStyle: 0 |
|||||
nMinorHashCount: 0 |
|||||
nSuperHashStyle: 1 |
|||||
nSuperHashCount: 0 |
|||||
Notes: |
For API use via the Set/GraphAttr calls, a copy of the TDG_GridLinesOrdInfo structure should be used. |
||||
Also See: |
|||||
Usage |
ObjectID |
SeriesID |
GroupID |
GraphTypes |
|
Requirements: |
No |
No |
No |
Bar, Line, Area, Radar, Stock, Spectral, and Gantt |
|
This attribute controls the appearance of secondary ordinal axis (O2) gridlines (i.e., lines attached to a text-based axis, like the bottom axis of a bar graph). Since these gridlines are not based on a numeric scale, they have fewer possible controls than numeric-based gridlines. However, you may define major, minor, and super gridlines that draw on the ordinal (group) axis. Major and minor gridlines are normally drawn between groups or at groups. Super gridlines are normally drawn every so many groups. So, for example, you could do one super gridline for every 10 regular gridlines. Super gridlines are to major gridlines as major gridlines are to minor. |
|||||
Type: |
typedef struct _TDG_GridLinesOrd { |
||||
Valid Range: |
See the TDG_GridLinesOrdInfo data structure in Appendix A |
||||
Default: |
nMajorHashStyle: 0 |
||||
nMinorHashStyle: 1 |
|||||
nMinorHashCount: 0 |
|||||
nSuperHashStyle: 0 |
|||||
nSuperHashCount: 0 |
|||||
Notes: |
For API use via the Set/GraphAttr calls, a copy of the TDG_GridLinesOrdInfo structure should be used. |
||||
Also See: |
|||||
Usage |
ObjectID |
SeriesID |
GroupID |
GraphTypes |
|
Requirements: |
No |
No |
No |
Spectral |
|
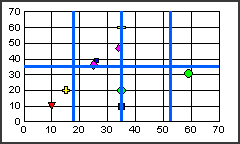
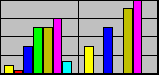
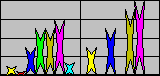
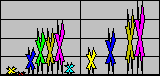
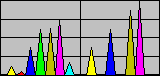
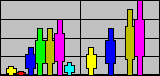
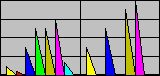
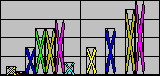
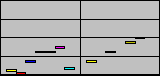
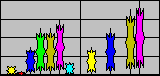
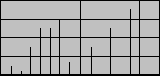
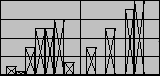
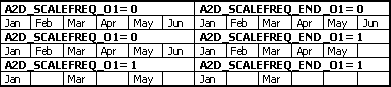
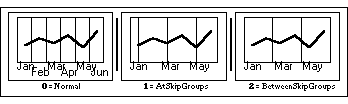
This attribute controls: 1) which major gridlines on the primary ordinal axis show and 2) whether the grids are drawn between the groups or at the center of the groups (except circular 2D charts, such as pies, polar, radar, and bubbles). When grids draw between groups, the grids display on either side of a group's data points. When grids draw at the group, a grid aligns at the center of each group's data points. If you want to hide some headers, this attribute lets you also hide the gridlines that would go with the missing headers as shown in the following illustrations: |
|||||||
|
|||||||
If you skip the header for every other month, you can hide gridlines for the missing headers and "move" the drawn gridlines between the points or through the points. |
|||||||
Type: |
INT16 |
||||||
Valid Range: |
One of the following #defines: |
||||||
#define |
Value |
Description |
|||||
GRIDMODE_NORMAL |
0 |
Gridlines are shown between each group |
|||||
GRIDMODE_ATSKIPGROUPS |
1 |
A gridline aligns at the center of each group that has a label displayed. When A2D_SCALEFREQ_O1 is >1, that value controls how many gridlines are drawn before one is skipped (hidden). e.g. a SCALEFREQ value of "3" will draw 3 major grids, skip the 4th, draw 3 more major grids, skip, etc. |
|||||
GRIDMODE_BETWEENSKIPGROUPS |
2 |
Same as ATSKIPGROUPS, except gridlines align between groups with a label (according to value set for A2D_SCALEFREQ_O1) |
|||||
Default: |
0 (GRIDMODE_NORMAL) |
||||||
Example: |
INT16 two = 2; |
||||||
Also See: |
|||||||
Usage |
ObjectID |
SeriesID |
GroupID |
GraphTypes |
|||
Requirements: |
No |
No |
No |
Bar, Line, Area, Radar, Stock, Spectral, and Gantt |
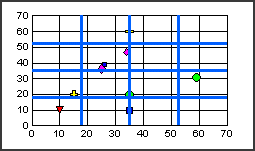
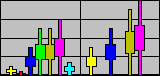
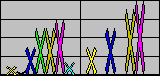
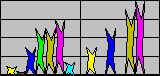
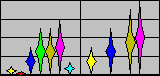
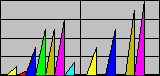
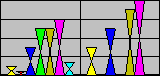
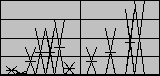
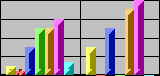
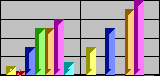
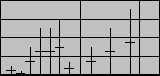
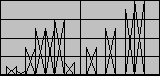
This attribute controls where minor gridlines are drawn: 1) between groups or 2) at the center of the groups (except circular 2D charts, such as pies, polar, radar, and bubbles). This feature was created so that when labels are skipped (leaving certain data groups without labels), minor gridlines can be used to indicate the data groups (see A2D_LABELMODE_O1). |
|||||||
Minor gridlines are either in normal or skip mode. If they are in normal mode, they depend on the major gridlines for placement - e.g. in example #1, the user requests 3 minor grids, so there are 3 minor grids between each major grid. If minor gridlines are set to skip mode (examples #2 & #3), there is only one minor grid per data group and the minor grids align according to the data groups rather than the major grids. So a user's request for "3 minor gridlines" becomes irrelevant, since both skip modes ignore major gridlines. |
|||||||
|
|||||||
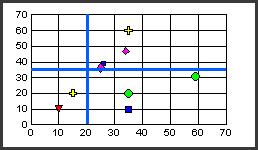
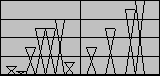
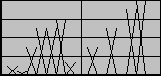
Note that when major grids/labels are in a skip mode and minor grids are in the normal mode, as shown in example #4, the user's requested number of minor gridlines divides up the remaining major gridlines - i.e. the user requests "3 minor gridlines", and this number is maintained despite the loss of major gridlines (compare examples #4 & #1 - there are fewer major grids in #4 but both #4 & #1 have 3 minor grids between major grids). |
|||||||
Also note that whether major grids/labels are in normal or skip mode, they have no effect on minor grids that are set in skip mode (note how minor grids in examples #2 & #5 are the same, and how minor grids in examples #3 & #6 are the same). This is because minor gridlines in skip mode are placed according to data groups - not major grids. |
|||||||
Type: |
INT16 |
||||||
Valid Range: |
One of the following #defines: |
||||||
#define |
Value |
Description |
|||||
GRIDMODE_NORMAL |
0 |
Minor gridlines are spaced evenly between each group. Values set within A2D_GRIDLINESORD_O1 determine style and count. |
|||||
GRIDMODE_ATSKIPGROUPS |
1 |
One minor gridline aligns at the center of each data group. |
|||||
GRIDMODE_BETWEENSKIPGROUPS |
2 |
One minor gridline aligns between each data group. |
|||||
Default: |
0 (GRIDMODE_NORMAL) |
||||||
Example: |
int nGridNormal = GRIDMODE_NORMAL;/* 0 */ |
||||||
Also See: |
|||||||
Usage |
ObjectID |
SeriesID |
GroupID |
GraphTypes |
|||
Requirements: |
No |
No |
No |
Bar, Line, Area, Radar, Stock, Spectral, and Gantt |
|||
This attribute is used to select a particular riser, marker, or pie slice and highlight it for the user. It determines whether the data riser is associated with the series attributes (same color, line style, marker shape, etc.) or is an independent, "highlighted" object. When set TRUE, the riser or marker will use a different color than the series color to which it belongs. |
||||||
Type: |
BOOLEAN16 |
|||||
Valid Range: |
TRUE/FALSE |
|||||
TRUE= |
Highlight one or more objects |
|||||
FALSE= |
Object shares the attributes of the entire series. |
|||||
Default: |
FALSE(0) |
|||||
Example: |
BOOLEAN bHighlightOn = TRUE; |
|||||
|
||||||
Notes: |
If you use SetGraphAttr() to apply this attribute, specify the object, series, and group ID of a particular object to be highlighted. If you use SetGraphAttrSI() or SetGraphAttrSL(), the currently selected item or all items in the selection list will be highlighted, respectively. |
|||||
Usage |
ObjectID |
SeriesID |
GroupID |
GraphTypes |
||
Requirements: |
Yes |
Yes |
No |
All except 3D Riser, 3D Scatter, and Tables |
||
When set TRUE, this attribute causes the system to ignore the specified group. When the graph is redrawn, the associated riser object, legend marker, and legend text will be removed from the graph. |
||||||
Type: |
typedef struct _TDG_SerDepBOOLEAN16 { |
|||||
Valid Range: |
nSeriesID: Any valid group number |
|||||
bValue: TRUE/FALSE |
||||||
TRUE= |
Ignore group |
|||||
FALSE= |
Don't ignore group |
|||||
Default: |
FALSE |
|||||
Also See: |
||||||
Usage |
ObjectID |
SeriesID |
GroupID |
GraphTypes |
||
Requirements: |
No |
Yes, must be set in nSeriesID |
No |
Bar, Line, Area, 3D Riser, Radar, Stock, and Spectral |
||
When set TRUE, this attribute causes the system to ignore the specified series. When the graph is redrawn, the associated riser object, legend marker, and legend text will be removed from the graph. |
||||||
Type: |
typedef struct _TDG_SerDepBOOLEAN16 { |
|||||
Valid Range: |
nSeriesID: Any valid series number |
|||||
bValue: TRUE/FALSE |
||||||
TRUE= |
Ignore series |
|||||
FALSE= |
Don't ignore series. |
|||||
Default: |
FALSE(0) |
|||||
Also See: |
||||||
Usage |
ObjectID |
SeriesID |
GroupID |
GraphTypes |
||
Requirements: |
No |
Yes, must be set in nSeriesID |
No |
All |
||
This attribute is used to set the mode for displaying labels on the primary ordinal (text-based) axis (O1). This allows you to hide headers in a specified or automatic order. This attribute affects all 2D graphs (except circular 2D charts, such as pies, polar, radar, and bubbles). |
|||||||
Type: |
INT16 |
||||||
Valid Range: |
One of the following #defines: |
||||||
#define |
Value |
Description |
|||||
LABELMODE_EVEN |
0 |
Normal label display: all labels display and are evenly spaced along the axis line. |
|||||
LABELMODE_EXACT |
1 |
All labels display, with each label aligned with its data group. If a data group lacks a header label, the missing label will be treated as an invisible label. e.g. on a vertical bar chart, there are four data groups and three labels. each label appears directly below its data group, except for the group with no label - that group has an empty space below it. |
|||||
LABELMODE_SKIPMANUAL |
2 |
User controls the number of labels displayed by displaying one label for every "x" number of groups. A value in A2D_SCALEFREQ_O1 controls which group labels are skipped, a value in A2D_SCALEFREQ_BEG_O1 controls which group gets the first label. |
|||||
LABELMODE_SKIPAUTO |
3 |
The program determines best skip value for displaying labels. |
|||||
Default: |
0 (LABELMODE_EVEN) |
||||||
Example: |
INT16 nSkipMode = LABELMODE_SKIPAUTO}; |
||||||
Also See: |
|||||||
Usage |
ObjectID |
SeriesID |
GroupID |
GraphTypes |
|||
Requirements: |
No |
No |
No |
Bar, Line, Area, 3D Riser, Radar, Stock, Spectral, Gantt, and Table |
This attribute is used to set the mode for displaying labels on the secondary ordinal (text-based) axis (O2). This allows you to hide headers in a specified or automatic order. This attribute affects all 2D graphs (except circular 2D charts, such as pies, polar, radar, and bubbles). |
|||||||
Type: |
INT16 |
||||||
Valid Range: |
One of the following #defines: |
||||||
#define |
Value |
Description |
|||||
LABELMODE_EVEN |
0 |
Normal label display: all labels display and are evenly spaced along the axis line. |
|||||
LABELMODE_EXACT |
1 |
All labels display, with each label aligned with its data group. If a data group lacks a header label, the missing label will be treated as an invisible label. e.g. on a vertical bar chart, there are four data groups and three labels. each label appears directly below its data group, except for the group with no label - that group has an empty space below it. |
|||||
LABELMODE_SKIPMANUAL |
2 |
User controls the number of labels displayed by displaying one label for every "x" number of groups. A value in A2D_SCALEFREQ_O1 controls which group labels are skipped, a value in A2D_SCALEFREQ_BEG_O1 controls which group gets the first label. |
|||||
LABELMODE_SKIPAUTO |
3 |
The program determines best skip value for displaying labels. |
|||||
Default: |
0 (LABELMODE_EVEN) |
||||||
Example: |
INT16 nSkipMode = LABELMODE_SKIPAUTO}; |
||||||
Also See: |
|||||||
Usage |
ObjectID |
SeriesID |
GroupID |
GraphTypes |
|||
Requirements: |
No |
No |
No |
Spectral |
|||
This attribute is used to set the number of lines for header labels on the primary ordinal (O1) axis. The axis must be horizontal - it will not work on a vertical O1 axis. This attribute allows headers to have more than one line of text. It affects O1-axis labels on all 2D graphs (except circular 2D charts, such as pies, polar, radar, and bubbles). A2D_LABELWRAPMODE affects this function by turning multi-line headers on or off. |
||||||
Type: |
INT16 |
|||||
Valid Range: |
Any value greater than 0. SEE NOTE. |
|||||
1= |
Header labels are limited to one line |
|||||
2= |
Header labels are limited to two lines. Whatever text does not fit on the first line will automatically continue on the second line |
|||||
3... |
allow that many lines of header text |
|||||
Default: |
1 (Header labels are limited to one line) |
|||||
Example: |
int two = 2; |
|||||
Notes: |
Although you may specify a large number of lines, headers with more than 3 - 4 lines will crowd out other graph objects. These multi-line headers do not support returns, soft returns, or tabs. |
|||||
Also See: |
||||||
Usage |
ObjectID |
SeriesID |
GroupID |
GraphTypes |
||
Requirements: |
No |
No |
No |
Bar, Line, Area, 3D Riser, Radar, Stock, Spectral, Gantt, and Table |
||
This attribute controls whether O1-axis labels may have more than one line. Note that the ordinal axis must be horizontal, this function will not work on a vertical axis. In other words, it will work on a vertical bar graph which has a horizontal O1 axis but it will not work on a horizontal bar graph. The system calculates line length by breaking up the line of text at word boundaries. It divides the longest label by a specified number of lines (set by A2D_LABELWRAPLINES_O1). The resulting value tells the system the "minimum characters per header line". Space characters at the end of a line are ignored. As an example, assume the labels are "Jan 92", "April 92" and "December 1992" and the number of lines is set to 2. Since, the length of the longest string (December 1992) divided by 2 lines equals 6 characters per line, the resulting labels are: |
|||||||||
Jan 92 |
April |
December |
|||||||
In this example, the minimum characters per header line is 6. Jan 92 is 6 characters, it fits on one line. The "April 92" string is 8 characters, so a 2nd line is necessary. December 1992 is 13 characters. December cannot be broken, so the first line is more than 6 characters. Remember that 6 is a minimum. |
|||||||||
Type: |
INT16 |
||||||||
Valid Range: |
One of the following #defines: |
||||||||
#define |
Value |
Description |
|||||||
LABELWRAP_OFF |
0 |
Label wrap mode is off. Headers must be on one line. |
|||||||
LABELWRAP_AUTO |
1 |
Automatic line wrapping. |
|||||||
Default: |
LABELWRAP_OFF (label wrap mode is off) |
||||||||
Example: |
SetGraphAttr (gpGraph,GRAPH_LAYER, |
||||||||
|
|||||||||
Notes: |
The text will be center aligned. |
||||||||
Also See: |
|||||||||
Usage |
ObjectID |
SeriesID |
GroupID |
GraphTypes |
|||||
Requirements: |
No |
No |
No |
Bar, Line, Area, 3D Riser, Radar, Stock, Spectral, Gantt, and Table |
|||||
Fancy boxes are rectangles that are drawn behind a given text or area object. They have different effects like bevels or extrusion so that the text stands out. Fancy boxes have an area fill, so they respond to calls to change area color, area pattern, etc.. Fancy boxes also have a line style, so they respond to changes to line width, line color, etc. This attribute applies a fancy box to the chart legend. |
|||||
Type: |
typedef struct _FancyBoxRec { |
||||
Valid Range: |
See the FancyBoxRec in Appendix A. |
||||
Default: |
None |
||||
Example: |
FancyBoxRec fb; |
||||
Also See: |
|||||
Usage |
ObjectID |
SeriesID |
GroupID |
GraphTypes |
|
Requirements: |
No |
No |
No |
All |
|
This attribute defines the legend state when the RecalcLegend() API is used. The legend placement defined by A2D_LEGEND_LOCK limits the recalculation of the legend's location. For example, if A2D_LEGEND_LOCK is set to LEGEND_DEFAULT_BOTTOM, the RecalcLegend() operation will realign the legend toward the bottom of the chart. If A2D_LEGEND_LOCK is set to LEGEND_FREE_FLOAT, RecalcLegend() can move the legend anywhere within the chart frame. |
|||||||
Type: |
INT16 |
||||||
Valid Range: |
A value from the DefaultLegendPlacementType enum: |
||||||
DefaultLegendPlacementType |
Value |
Description |
|||||
LEGEND_FREE_FLOAT |
0 |
Legend is free floating |
|||||
LEGEND_DEFAULT_RIGHT |
1 |
Lock legend placement to right of chart |
|||||
LEGEND_DEFAULT_LEFT |
2 |
Lock legend placement to left of chart |
|||||
LEGEND_DEFAULT_BOTTOM |
3 |
Lock legend placement to bottom of chart |
|||||
Also See: |
RecalcLegend() |
||||||
Note: |
The PlaceDefaultElements() API will change to the value of this attribute to LEGEND_FREE_FLOAT. |
||||||
Usage |
ObjectID |
SeriesID |
GroupID |
GraphTypes |
|||
Requirements: |
No |
No |
No |
All |
|||
This attribute defines the orientation of legend markers relative to the legend text. |
||||||||
Type: |
INT16 |
|||||||
Valid Range: |
A value from the MarkerLayoutType enum: |
|||||||
MarkerLayoutType |
Value |
Description |
||||||
MARKER_LEFT |
0 |
Markers to the left of legend text |
|
|||||
MARKER_RIGHT |
1 |
Markers to the right of legend text |
|
|||||
MARKER_CENTERED |
2 |
Markers centered on top of legend text |
|
|||||
MARKER_ABOVE |
3 |
Markers above legend text |
|
|||||
MARKER_BELOW |
4 |
Markers below legend text |
|
|||||
Default: |
MARKER_LEFT |
|||||||
Usage |
ObjectID |
SeriesID |
GroupID |
GraphTypes |
||||
Requirements: |
No |
No |
No |
All |
||||
This attribute is used to set the position of the bounding box for the legend within the overall graph (i.e., where it is positioned on the Background). This attribute controls both the size and the position of the object. It is expressed in virtual coordinates. It affects the object O5D_LEGENDS. |
|||||
Type: |
typedef struct { |
||||
Valid Range: |
See the BoxInstRec structure in Appendix A. |
||||
Default: |
xULC = -8025, yULX = -11395, zLRC = 10281, yLRC = -13480 |
||||
Notes: |
The legend box should be large enough to accommodate the legend markers and text set by A2D_INSET_LGND_ICON and A2D_INSET_LGND_TEXT, respectively. |
||||
Example: |
BoxInstRec NewLegLoc; |
||||
Also See: |
|||||
Usage |
ObjectID |
SeriesID |
GroupID |
GraphTypes |
|
Requirements: |
No |
No |
No |
All except 3D Riser, Spectral, Histogram, and Table |
|
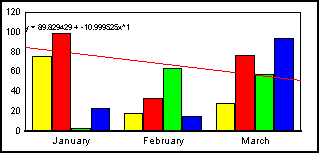
The value of this attribute controls the position of the correction coefficient and formula text object that is associated with the series-dependent data lines. |
|||||
Type: |
typedef struct { |
||||
Valid Range: |
See the BoxInstRec structure in Appendix A. |
||||
Default: |
xULC = 0, yULC = 0, xLRC = 0, yLRC = 0 |
||||
Example: |
BoxInstRec Location1; |
||||
Notes: |
Use A2D_SDLINELINR_FORMULA or A2D_SDLINELINR_CORR to display the O2D_LINR_TEXT object. Also, note that an associated series-dependent line must be enabled before the text can be drawn or located. |
||||
Also See: |
A2D_SDLINELINR_EXP, A2D_SDLINELINR_LINE, A2D_SDLINELINR_LOG, A2D_SDLINELINR_NATLOG, A2D_SDLINELINR_NPOLY, A2D_SDLINELINR_FORMULA, A2D_SDLINELINR_CORR |
||||
Usage |
ObjectID |
SeriesID |
GroupID |
GraphTypes |
|
Requirements: |
No |
No |
No |
Bar, Line, Area, Scatter, Bubble, Stock, Gantt, and Histogram |
|
A2D_LOCATE_TITLE_X/Y1/Y2/Y3/Y4
These attributes set the position and size of the bounding box for a numeric axis title (i.e., where it is positioned on the chart background). It controls the size and the position of the object. It is expressed in virtual coordinates. |
|||||
Type: |
struct { |
||||
Valid Range: |
See the BoxInstRec structure in Appendix A. |
||||
Default: |
xULC: -15922, yULC: 11988, xLRC: -15272, yLRC: -9932 |
||||
Example: |
BoxInstRec Location1; |
||||
Notes: |
Use one of the A2D_SHOW_TITLE_... attributes to draw the associated title object. |
||||
Also See: |
|||||
Usage |
ObjectID |
SeriesID |
GroupID |
GraphTypes |
|
Requirements: |
No |
No |
No |
A2D_LOCATE_TITLE_X: |
|
Scatter, Polar, Bubble, & Histogram |
|||||
A2D_LOCATE_TITLE_Y1: |
|||||
All except Pie, 3D Riser, 3D Scatter, and Table |
|||||
A2D_LOCATE_TITLE_Y2: |
|||||
Dual-Axes and BI-Polar Only |
|||||
A2D_LOCATE_TITLE_Y3/Y4: |
|||||
Bar, Line, Area, Stock, & Scatter |
|||||
A2D_LOG_X/Y1/Y2/Y3/Y4
These attributes select the scale (logarithmic or linear) for a numeric axis. |
||||||
Type: |
BOOLEAN16 |
|||||
Valid Range: |
TRUE/FALSE |
|||||
TRUE= |
Use the logarithmic scale |
|||||
FALSE= |
Use the linear scale |
|||||
Default: |
FALSE(0) |
|||||
Example: |
BOOLEAN16 bTRUE; |
|||||
|
||||||
BOOLEAN16 bFALSE; |
||||||
|
||||||
Notes: |
Linear/logarithmic scaling can also be set by one of the A2D_GRIDLINES_... attributes. |
|||||
Usage |
ObjectID |
SeriesID |
GroupID |
GraphTypes |
||
Requirements: |
No |
No |
No |
A2D_LOG_X: |
||
Scatter, Polar, Bubble, & Histogram |
||||||
A2D_LOG_Y1: |
||||||
All except Pie, 3D Riser, 3D Scatter, and Table |
||||||
A2D_LOG_Y2: |
||||||
Dual-Axes and BI-Polar Only |
||||||
A2D_LOG_Y3/Y4: |
||||||
Bar, Line, Area, Stock, & Scatter |
||||||
A2D_MANUAL_PICTOGRAPH_SCALE_VALUE
This attribute and the A2D_USE_MANUAL_PICTOGRAPH_SCALE attribute allow pictograms to be stacked according to a unit/scale you provide. Use the A2D_USE_MANUAL_PICTOGRAPH_SCALE attribute to enable the use of the value assigned to this attribute. Use this attribute to define you own unit/scale. |
|||||
Type: |
REAL64 |
||||
Valid Range: |
Any value that represents the size of one pictogram element |
||||
Default: |
None |
||||
Example: |
Assume the chart's Y-axis scale is 0...10,000 and the chart's scale is 0,2000,4000,6000,8000,10000. When the A2D_USE_MANUAL_PICTOGRAPH_SCALE attribute is TRUE, the engine will pick the size of the interval of this scale (2000) as the size of the pictogram unit. So, a bar with a value of 5000 will be represented by 2 1/2 pictogram units. If you want the pictogram unit to be 5000, do the the following: |
||||
BOOLEAN16 bValue = TRUE; |
|||||
When the chart is drawn, a bar with a value of 5000.0 will be represented by 1 (much larger) pictogram unit. |
|||||
Also See: |
A2D_USE_MANUAL_PICTOGRAPH_SCALE, ABA_PICTOGRAPH |
||||
Usage |
ObjectID |
SeriesID |
GroupID |
GraphTypes |
|
Requirements: |
No |
No |
No |
Side-by-Side Bar Chart Only |
|
This attribute determines the shape of risers in bar type graphs and the shape of markers. It also affects the legend icons that represent the risers/markers. |
|||||||
Type: |
INT16 |
||||||
Valid Range: |
A value from the ShapeType enum: |
||||||
ShapeType |
Value |
Description |
|||||
NoMarker |
0= |
||||||
SRectangle |
1= |
|
|||||
NStar45 |
2= |
|
|||||
Plus |
3= |
|
|||||
Circle |
4= |
|
|||||
Diamond |
5= |
|
|||||
SpikedX |
6= |
|
|||||
PlainX |
7= |
|
|||||
IsTri1 (isosceles triangles) |
8= |
|
|||||
NStarSkewed |
9= |
|
|||||
FatPlus |
10= |
|
|||||
NStar90 |
11= |
|
|||||
SoftX |
12= |
|
|||||
PiratePlus |
13= |
|
|||||
FatX |
14= |
|
|||||
Castle |
15= |
|
|||||
IsTri2 |
16= |
|
|||||
IsTri3 |
17= |
|
|||||
IsTri4 |
18= |
|
|||||
RtTri1 |
19= |
|
|||||
RtTri2 |
20= |
|
|||||
RtTri3 |
21= |
|
|||||
RtTri4 |
22= |
|
|||||
SEllipse |
23= |
|
|||||
Square |
24= |
|
|||||
Hexagon |
25= |
|
|||||
Pentagon |
26= |
|
|||||
House |
27= |
|
|||||
Pentagram |
28= |
|
|||||
FontMarker |
29= |
|
|||||
BoxedPlus |
30= |
|
|||||
BoxedX |
31= |
|
|||||
HourGlass |
32= |
|
|||||
HourGlassTransparent |
33= |
|
|||||
VerticalLine |
34= |
|
|||||
HorizontalLine |
35= |
|
|||||
Asterisk |
36= |
|
|||||
Star5 |
37= |
|
|||||
Star6 |
38= |
|
|||||
Star8 |
39= |
|
|||||
BevelBox |
40= |
|
|||||
ReverseBevelBox |
41= |
|
|||||
SlimHorizontalLine |
42= |
|
|||||
SlimVerticalLine |
43= |
|
|||||
SlimPlus |
44= |
|
|||||
SlimBoxedPlus |
45= |
|
|||||
SlimX |
46= |
|
|||||
SlimBoxedX |
47= |
|
|||||
RotatedHourGlass |
48= |
|
|||||
SmallBevelBox |
49= |
||||||
Default: |
1 (SRectangle) |
||||||
Example: |
/* Let risers have different shapes */ |
||||||
|
|||||||
Also See: |
|||||||
Usage |
ObjectID |
SeriesID |
GroupID |
GraphTypes |
|||
Requirements: |
O2D_RISER |
Yes |
Yes |
All except 3D Riser |
|||
This attribute determines the shape of risers in bar type graphs and the shape of markers for a particular series. It also affects the legend icons that represent the risers/markers. |
|||||
Type: |
typedef struct _TDG_SerDepINT16 { |
||||
Valid Range: |
nSeriesID: Series ID |
||||
nValue: A value from the ShapeType enum. See A2D_MARKERSHAPE for examples and possible values. |
|||||
Default: |
1 (SRectangle) |
||||
Also See: |
|||||
Usage |
ObjectID |
SeriesID |
GroupID |
GraphTypes |
|
Requirements: |
O2D_RISER |
Yes |
Yes |
All except 3D Riser |
|
This attribute is used to change the size of markers on Line, Scatter, and Spectral Map type graphs. |
|||||
Type: |
INT16 |
||||
Valid Range: |
Any INT16 value. Zero draws a marker of zero size (invisible). |
||||
Default: |
750 |
||||
Example: |
INT16 iDouble = 1500; |
||||
Notes: |
See A2D_BAR_RISER_WIDTH if you want to change the relative size of risers in a Bar type graph. |
||||
Also See: |
|||||
Usage |
ObjectID |
SeriesID |
GroupID |
GraphTypes |
|
Requirements: |
No |
No |
No |
Bar, Line, Area, 3D Scatter, Scatter, Polar, and Radar |
|
This attribute is used to change the size of markers on Line, Scatter, and Spectral Map type graphs for a particular series. |
|||||
Type: |
typedef struct _TDG_SerDepINT16 { |
||||
Valid Range: |
nSeriesID: Series ID |
||||
nValue: Any INT16 value. Zero draws a marker of zero size (invisible). |
|||||
Default: |
750 |
||||
Also See: |
|||||
Usage |
ObjectID |
SeriesID |
GroupID |
GraphTypes |
|
Requirements: |
No |
No |
No |
Bar, Line, Area, 3D Scatter, Scatter, Polar, and Radar |
|
This attribute moves a series to the top/bottom or normal in a stacked bar chart. |
|||||||
Type: |
typedef struct _TDG_SerDepINT16 { |
||||||
Valid Range: |
nSeriesID: Series ID |
||||||
nValue: One of the following #defines: |
|||||||
#define |
Value |
Description |
|||||
SERIES_NORMAL |
0 |
Move series to normal position |
|||||
SERIES_TOP |
1 |
Move series to top |
|||||
SERIES_BOTTOM |
2 |
Move series to bottom |
|||||
Default: |
SERIES_NORMAL (0) |
||||||
Usage |
ObjectID |
SeriesID |
GroupID |
GraphTypes |
|||
Requirements: |
No |
Yes |
No |
Stacked bar chart only |
|||
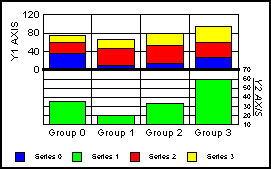
The attribute defines the number of numeric (Y1, Y2, Y3, and Y4) axis to appear in a chart. It also defines the starting and ending range of data to be charted on each axis. |
|||||
Type: |
typedef struct _TDG_MultiYInfo{ |
||||
Valid Range: |
nY1Start; Where on Frame to Start drawing Y1 axis (0...100) |
||||
nY1Stop; Where on Frame to Stop drawing Y1 axis (0...100) |
|||||
nY2Start; Where on Frame to Start drawing Y2 axis (0...100) |
|||||
nY2Stop; Where on Frame to Stop drawing Y2 axis (0...100) |
|||||
nY3Start; Where on Frame to Start drawing Y3 axis (0...100) |
|||||
nY3Stop; Where on Frame to Stop drawing Y3 axis (0...100) |
|||||
nY4Start; Where on Frame to Start drawing Y4 axis (0...100) |
|||||
nY4Stop; Where on Frame to Stop drawing Y4 axis (0...100) |
|||||
bUseY2; TRUE = Chart can use Y2 axis. FALSE = Chart does not use this axis. |
|||||
bUseY3; TRUE = Chart can use Y3 axis. FALSE = Chart does not use this axis. |
|||||
bUseY4; TRUE = Chart can use Y4 axis. FALSE = Chart does not use this axis. |
|||||
Usage |
ObjectID |
SeriesID |
GroupID |
GraphTypes |
|
Requirements: |
No |
No |
No |
Bar, Line, Area, Stock, & Scatter |
|
This attribute controls the inset of chart risers on the ordinal axis. |
|||||
Type: |
INT16 |
||||
Valid Range: |
0...1 |
||||
Default: |
0 |
||||
Usage |
ObjectID |
SeriesID |
GroupID |
GraphTypes |
|
Requirements: |
No |
No |
No |
Bar, Line, Area |
|
This attribute controls the vertical/horizontal alignment of a graph. |
||||||
Type: |
BOOLEAN16 |
|||||
Valid Range: |
TRUE/FALSE |
|||||
TRUE= |
Selects vertical alignment of the graph |
|||||
FALSE= |
Selects horizontal alignment of the graph. |
|||||
Default: |
TRUE (1) - Vertical Alignment |
|||||
Example: |
SetGraphAttr(gpGraph,GRAPH_LAYER, |
|||||
|
||||||
SetGraphAttr(gpGraph,GRAPH_LAYER, |
||||||
|
||||||
Notes: |
Changing the chart type resets the chart's orientation to the default value (vertical alignment). |
|||||
Also See: |
||||||
Usage |
ObjectID |
SeriesID |
GroupID |
GraphTypes |
||
Requirements: |
No |
No |
No |
Bar, Line, Area, Scatter, Bubble, Stock, Spectral, Gantt, and Histogram |
||
A2D_PLACE_O1/O2
These attributes control the placement of data text on or next to a graph riser or marker for the ordinal (O1 and O2) axes. If data text is drawn (A2D_SHOW_DATATEXT is TRUE), changing this attribute will rearrange the placement of the data text. |
|||||||
Type: |
INT16 |
||||||
Valid Range: |
One of the following #defines: |
||||||
#define |
Value |
Description |
|||||
DTXT_CENTER |
0 |
Data Text is placed in CENTER of riser. |
|||||
DTXT_OUT_MIN |
1 |
Data Text is placed just OUTSIDE the MINIMUM of the riser (under bottom of bar or data marker). |
|||||
DTXT_IN_MIN |
2 |
Data Text is placed just INSIDE the MINIMUM of a riser (inside bottom of bar or data marker). |
|||||
DTXT_IN_MAX |
3 |
Data Text is placed INSIDE the MAXIMUM of a riser (for a bar, text goes just inside the bar from the top of the riser; for a data marker, just inside the "top" side of the marker). |
|||||
DTXT_OUT_MAX |
4 |
Data Text is placed just OUTSIDE the MAXIMUM of the riser (on top of bar or data marker). |
|||||
Default: |
0 (Data Text is placed in CENTER of riser) |
||||||
Example: |
//Show numeric value only |
||||||
Also See: |
|||||||
Usage |
ObjectID |
SeriesID |
GroupID |
GraphTypes |
|||
Requirements: |
No |
No |
No |
A2D_PLACE_O1: |
|||
Bar, Line, Area, Radar, Stock, and Spectral |
|||||||
A2D_PLACE_O2: |
|||||||
Spectral Maps ONLY |
A2D_PLACE_X/Y1/Y2/Y3/Y4
These attributes control the placement of data text on or next to a riser or marker on a numeric axis. If data text is drawn (A2D_SHOW_DATATEXT is TRUE), changing this attribute will rearrange the placement of the data text. |
|||||||
Type: |
INT16 |
||||||
Valid Range: |
One of the following #defines: |
||||||
#define |
Value |
Description |
|||||
DTXT_CENTER |
0 |
Data Text is placed in CENTER of riser. |
|||||
DTXT_OUT_MIN |
1 |
Data Text is placed just OUTSIDE the MINIMUM of the riser (under bottom of bar or data marker). |
|||||
DTXT_IN_MIN |
2 |
Data Text is placed just INSIDE the MINIMUM of a riser (inside bottom of bar or data marker). |
|||||
DTXT_IN_MAX |
3 |
Data Text is placed INSIDE the MAXIMUM of a riser (for a bar, text goes just inside the bar from the top of the riser; for a data marker, just inside the "top" side of the marker). |
|||||
DTXT_OUT_MAX |
4 |
Data Text is placed just OUTSIDE the MAXIMUM of the riser (on top of bar or data marker). |
|||||
Default: |
4 (DTXT_OUT_MAX) |
||||||
Example: |
INT16 Top = DTXT_IN_MAX; |
||||||
|
|||||||
Notes: |
Use one of the A2D_FORMATDTXT_... attributes to change the format of this data text. |
||||||
Also See: |
|||||||
Usage |
ObjectID |
SeriesID |
GroupID |
GraphTypes |
|||
Requirements: |
No |
No |
No |
A2D_DIRECTION_X: |
|||
Scatter, Polar, Bubble, & Histogram |
|||||||
A2D_DIRECTION_Y1: |
|||||||
All except Pie, 3D Riser, 3D Scatter, and Table |
|||||||
A2D_DIRECTION_Y2: |
|||||||
Dual-Axes and BI-Polar Only |
|||||||
A2D_DIRECTION_Y3/Y4: |
|||||||
Bar, Line, Area, Stock, & Scatter |
For 2D Scatter graphs, this attribute enables/disables drawing of a pre-series dependent line that connects data points (i.e., the O2D_PRESDL_CONN object). |
||||||
Type: |
BOOLEAN16 |
|||||
Valid Range: |
TRUE/FALSE |
|||||
TRUE = |
Enable display of pre-series dependent line object |
|||||
FALSE= |
Disable display of pre-series dependent line object |
|||||
Default: |
FALSE |
|||||
Example: |
nSeriesID = 2; |
|||||
|
||||||
Notes: |
This attribute affects 2-D Scatter charts only. |
|||||
Also See: |
A2D_PRESDL_CONNBRK, A2D_PRESDL_STEP, A2D_PRESDL_STEPBRK, A2D_PRESDL_STEPVERT |
|||||
Usage |
ObjectID |
SeriesID |
GroupID |
GraphTypes |
||
Requirements: |
No |
Yes |
No |
Scatter, Bubble |
||
For 2D Scatter graphs, this attribute enables/disables drawing of a pre-series dependent line that connects data points with breaks for missing data points (i.e., the O2D_PRESDL_CONNBRK object). |
||||||
Type: |
BOOLEAN16 |
|||||
Valid Range: |
TRUE/FALSE |
|||||
TRUE = |
Enable display of pre-series dependent line object |
|||||
FALSE= |
Disable display of pre-series dependent line object |
|||||
Default: |
FALSE |
|||||
Also See: |
A2D_PRESDL_CONN, A2D_PRESDL_STEP, A2D_PRESDL_STEPBRK, A2D_PRESDL_STEPVERT |
|||||
Usage |
ObjectID |
SeriesID |
GroupID |
GraphTypes |
||
Requirements: |
No |
Yes |
No |
Scatter, Bubble |
||
For 2D Scatter graphs, this attribute enables/disables drawing of a pre-series dependent stepped line that connects data points (i.e., the O2D_PRESDL_STEP object). |
||||||
Type: |
BOOLEAN16 |
|||||
Valid Range: |
TRUE/FALSE |
|||||
TRUE = |
Enable display of pre-series dependent line object |
|||||
FALSE= |
Disable display of pre-series dependent line object |
|||||
Default: |
FALSE |
|||||
Example: |
nSeriesID = 2; |
|||||
|
||||||
Also See: |
A2D_PRESDL_CONN, A2D_PRESDL_CONNBRK, A2D_PRESDL_STEPBRK, A2D_PRESDL_STEPVERT |
|||||
Usage |
ObjectID |
SeriesID |
GroupID |
GraphTypes |
||
Requirements: |
No |
Yes |
No |
Scatter, Bubble |
||
For 2D Scatter graphs, this attribute enables/disables drawing of a pre-series dependent stepped line that connects data points with breaks for missing data points (i.e., the O2D_PRESDL_STEPBRK object). |
||||||
Type: |
BOOLEAN16 |
|||||
Valid Range: |
TRUE/FALSE |
|||||
TRUE = |
Enable display of pre-series dependent line object |
|||||
FALSE= |
Disable display of pre-series dependent line object |
|||||
Default: |
FALSE |
|||||
Also See: |
A2D_PRESDL_CONN, A2D_PRESDL_CONNBRK, A2D_PRESDL_STEP, A2D_PRESDL_STEPVERT |
|||||
Usage |
ObjectID |
SeriesID |
GroupID |
GraphTypes |
||
Requirements: |
No |
Yes |
No |
Scatter, Bubble |
||
For 2D Scatter graphs, this attribute enables/disables drawing of a pre-series dependent line stepped vertical line that connects data points (i.e., the O2D_PRESDL_STEPVERT object). |
||||||
Type: |
BOOLEAN16 |
|||||
Valid Range: |
nSeriesID: Specify the series ID where the line is to be drawn. |
|||||
bValue: TRUE/FALSE |
||||||
TRUE = |
Enable display of pre-series dependent line object |
|||||
FALSE= |
Disable display of pre-series dependent line object |
|||||
Default: |
FALSE |
|||||
Also See: |
A2D_PRESDL_CONN, A2D_PRESDL_CONNBRK, A2D_PRESDL_STEP, A2D_PRESDL_STEPBRK |
|||||
Usage |
ObjectID |
SeriesID |
GroupID |
GraphTypes |
||
Requirements: |
No |
Yes |
No |
Scatter, Bubble |
||
A2D_SCALE_X/Y1/Y2/Y3/Y4/Z
These attributes define how values labels are calculated and drawn on a numeric axis. It affects axis labels, gridlines, and data riser objects related to the numeric axis in all 2D graphs except pie charts. The elements of the data structure define full automatic scaling, manual scaling of the minimum value, manual scaling of the maximum value, or manual scaling of the minimum and maximum value. When automatic scaling is selected, the charting engine calculates and draws value labels on the axis based on the range of data in the data source that defines the graph. When manual scaling is selected, the values defined in fManualScaleMax and/or fManualScaleMin will be used as the maximum and/or minimum values on the axis. |
|||||
Type: |
typedef struct _TDG_ScaleValues { |
||||
Valid Range: |
See the TDG_ScaleValuesInfo structure in Appendix A. |
||||
Default: |
nManualScale; 0 |
||||
fManualScaleMin; 0.0 |
|||||
fManualScaleMax: X= 10000.0 |
|||||
Default: |
nManualScale = 0; |
||||
fManualScaleMin = 0.0 |
|||||
fManualScaleMax: 800.0 |
|||||
Also See: |
|||||
Usage |
ObjectID |
SeriesID |
GroupID |
GraphTypes |
|
Requirements: |
No |
No |
No |
A2D_SCALE_X: |
|
Scatter, Polar, Bubble, & Histogram |
|||||
A2D_SCALE_Y1: |
|||||
All except Pie, 3D Riser, 3D Scatter, and Table |
|||||
A2D_SCALE_Y2: |
|||||
Dual-Axes and BI-Polar Only |
|||||
A2D_SCALE_Y3/Y4: |
|||||
Bar, Line, Area, Stock, & Scatter |
|||||
A2D_SCALE_Z: |
|||||
3D Scatter Charts Only |
|||||
In applications where the data can include negative numbers, this attribute determines whether risers are drawn pointing up and down from a zero line or whether all risers are drawn up from the "bottom" of the graph. It affects axis labels, gridlines, and risers on all 2D graphs except Pies. |
||||||
Type: |
INT16 |
|||||
Valid Range: |
0/1 |
|||||
0= |
Draw from the base of the frame |
|||||
1= |
Draw from the zero line |
|||||
Default: |
0 (draw from the base of the frame) |
|||||
Example: |
SetGraphAttr(gpGraph,GRAPH_LAYER, |
|||||
|
||||||
SetGraphAttr(gpGraph,GRAPH_LAYER, |
||||||
|
||||||
Also See: |
A2D_SCALE_... |
|||||
Usage |
ObjectID |
SeriesID |
GroupID |
GraphTypes |
||
Requirements: |
No |
No |
No |
All except Pie and Table |
||
A2D_SCALEEND_O1/O2
These attributes control whether or not the labels for the first and last values of a scale will display on the ordinal axis (O1 or O2). It is used to mask off the minimum and/or maximum values of a scale. |
|||||||
Type: |
INT16 |
||||||
Valid Range: |
One of the following #defines: |
||||||
#define |
Value |
Description |
|||||
SCALEEND_BOTH |
0 |
A "normal" axis scale; all values, including minimum and maximum, are visible. |
|||||
SCALEEND_MINONLY |
1= |
The maximum value is not drawn |
|||||
SCALEEND_MAXONLY |
2= |
The minimum value is not drawn |
|||||
SCALEEND_NONE |
3= |
Neither the minimum nor the maximum value is show on the axis scale. |
|||||
Default: |
0 (SALEEND_BOTH) |
||||||
Usage |
ObjectID |
SeriesID |
GroupID |
GraphTypes |
|||
Requirements: |
No |
No |
No |
A2D_SCALEEND_O1: |
|||
Bar, Line, Area |
|||||||
A2D_SCALEEND_O2: |
|||||||
Spectral Maps ONLY |
|||||||
A2D_SCALEEND_X/Y1/Y2/Y3/Y4/Z
These attributes control whether or not the labels for the first and last values of a scale will display on a numerix axis. It is used to mask off the minimum and/or maximum values of a scale. For example: when the user does not want to see "0" as the origin, but merely wants the scale to start at the next increment, set this attribute to SCALEEND_MAXONLY to draw all numbers in the scale except the least ("0"). |
|||||||
Type: |
INT16 |
||||||
Valid Range: |
One of the following #defines: |
||||||
#define |
Value |
Description |
|||||
SCALEEND_BOTH |
0 |
A "normal" axis scale; all values, including minimum and maximum, are visible. |
|||||
SCALEEND_MINONLY |
1= |
The maximum value is not drawn |
|||||
SCALEEND_MAXONLY |
2= |
The minimum value is not drawn |
|||||
SCALEEND_NONE |
3= |
Neither the minimum nor the maximum value is show on the axis scale. |
|||||
Default: |
0 (SALEEND_BOTH) |
||||||
Example: |
INT16 nShowNone = 3; |
||||||
|
|||||||
Also See: |
A2D_SCALE_..., A2D_SCALEBASE, A2D_SCALEFREQ_BEG_..., A2D_SCALEFREQ_END_..., A2D_SCALEFREQ_... |
||||||
Usage |
ObjectID |
SeriesID |
GroupID |
GraphTypes |
|||
Requirements: |
No |
No |
No |
A2D_SCALEEND_X: |
|||
Scatter, Polar, Bubble, & Histogram |
|||||||
A2D_SCALEEND_Y1: |
|||||||
All except Pie, 3D Riser, 3D Scatter, and Table |
|||||||
A2D_SCALEEND_Y2: |
|||||||
Dual-Axes and BI-Polar Only |
|||||||
A2D_SCALEEND_Y3/Y4: |
|||||||
Bar, Line, Area, Stock, & Scatter |
|||||||
A2D_SCALEEND_Z: |
|||||||
3D Scatter Charts Only |
|||||||
A2D_SCALEFREQ_BEG_O1/O2
These attributes work in conjunction with A2D_SCALEFREQ_O1/O2 to skip header labels on an ordinal axis. A2D_SCALEFREQ_O1 or _O2 divides data groups into sets and lets you display one label per set. This attribute lets you select which label is chosen from each set. As an example, assume you have group labels for each month of the year and have set A2D_SCALEFREQ_O1 to display every third label (Jan, Apr, Jul, Oct). This attribute allows you to select a different label in each set (e.g., second label in each set Feb, May, Aug, Nov, third in each set Mar, Jun, Sep, Dec, etc.). Although header labels will disappear, data will remain untouched. In this simple example, the audience is well acquainted with the names of months and will easily "fill in the blanks". This feature depends on audience knowledge; omitting labels from a group of random names does not give the audience a chance to fill in the blanks. This attribute affects the O1-axis header labels on all 2D graphs (except circular 2D charts, such as pies, polar, radar, and bubbles). Note that this may allow the last set to miss a label. For example if there are 10 groups, A2D_SCALEFREQ_O1 is set to "4" (4 groups per set) & A2D_SCALEFREQ_BEG_O1 is set to "3" (display third label in each set), then the third set will not have a label. |
||||||
Type: |
INT16 |
|||||
Valid Range: |
Zero to the number of data groups per set as specified by A2D_SCALEFREQ_O1 or _O2. |
|||||
0= |
The first group's label from each set displays on the O1/O2-axis. |
|||||
1= |
The second group's label from each set displays on the O1/O2-axis. |
|||||
2...x= |
This value determines which label will display in each set. It must be less than or equal to the number of data groups per set |
|||||
Default: |
0 (the first group's label from each set displays on the axis) |
|||||
Example: |
//Begin group # of skipped labels |
|||||
Also See: |
A2D_SCALEFREQ_O1/O2, A2D_SCALEFREQ_END_O1/O2 |
|||||
Usage |
ObjectID |
SeriesID |
GroupID |
GraphTypes |
||
Requirements: |
No |
No |
No |
A2D_SCALEEND_BEG_O1: |
||
Bar, Line, Area |
||||||
A2D_SCALEEND_BEG_O2: |
||||||
Spectral Maps ONLY |
||||||
A2D_SCALEFREQ_BEG_X/Y1/Y2/Y3/Y4
These attributes are used in conjunction with A2D_SCALEFREQ_... and A2D_SCALEFREQ_END_... to control the number of labels to draw on a numeric axis. When a scale frequency is not specified or is set to zero by A2D_SCALEFREQ_..., this attribute identifies the first label to draw. |
||||||
A2D_SCALEFREQ_BEG_...=0 |
A2D_SCALEFREQ_BEG_...=1 |
|||||
1000 |
1000 |
|||||
900 |
900 |
|||||
800 |
800 |
|||||
700 |
700 |
|||||
600 |
600 |
|||||
500 |
500 |
|||||
400 |
||||||
When A2D_SCALEFREQ_... is non-zero, labels are divided into groups (# of labels divided by A2D_SCALEFREQ_...+1) and A2D_SCALEFREQ_BEG_... specifies the first label in each group: |
||||||
A2D_SCALEFREQ_...=1 |
A2D_SCALE_FREQ_...=1 |
|||||
1000 |
||||||
900 |
||||||
800 |
||||||
700 |
||||||
600 |
||||||
500 |
||||||
400 |
||||||
Type: |
INT16 |
|||||
Valid Range: |
Zero to the number of labels in the graph or in a label group (grouped by A2D_SCALEFREQ_X) |
|||||
Default: |
Zero |
|||||
Example: |
INT16 nOne = 1; |
|||||
Notes: |
A2D_SCALEEND_... also affects the A2D_SCALEFREQ_... attribute. |
|||||
Also See: |
A2D_SCALE_..., A2D_SCALEBASE, A2D_SCALEEND_..., A2D_SCALEFREQ_END_..., A2D_SCALEFREQ_... |
|||||
Usage |
ObjectID |
SeriesID |
GroupID |
GraphTypes |
||
Requirements: |
No |
No |
No |
A2D_SCALEEND_X: |
||
Scatter, Polar, Bubble, & Histogram |
||||||
A2D_SCALEEND_Y1: |
||||||
All except Pie, 3D Riser, 3D Scatter, and Table |
||||||
A2D_SCALEEND_Y2: |
||||||
Dual-Axes and BI-Polar Only |
||||||
A2D_SCALEEND_Y3/Y4: |
||||||
Bar, Line, Area, Stock, & Scatter |
A2D_SCALEFREQ_END_O1/O2
These attribute are used in conjunction with A2D_SCALEFREQ_O1/O2 and A2D_SCALEFREQ_BEG_O1/O2 to control the number of labels that are drawn on an ordinal axis. When a label frequency has not been specified or a label frequency of zero is specified, this attribute defines the last label to be drawn: |
|||||
|
|||||
Type: |
INT16 |
||||
Valid Range: |
Zero to the number of ordinal axis labels or label groups (set by A2D_SCALEFREQ_O1/O2) in the graph. |
||||
Default: |
Zero |
||||
Example: |
//Don't draw last label |
||||
Also See: |
A2D_SCALEFREQ_O1/O2, A2D_SCALEFREQ_BEG_O1/O2 |
||||
Usage |
ObjectID |
SeriesID |
GroupID |
GraphTypes |
|
Requirements: |
No |
No |
No |
A2D_SCALEEND_END_O1: |
|
Bar, Line, Area |
|||||
A2D_SCALEEND_END_O2: |
|||||
Spectral Maps ONLY |
|||||
A2D_SCALEFREQ_END_X/Y1/Y2/Y3/Y4
These attributes are used in conjunction with A2D_SCALEFREQ_... and A2D_SCALEFREQ_BEG_... to control the number of labels to draw on a numeric axis. When a scale frequency is not specified or is set to zero by A2D_SCALEFREQ_..., this attribute identifies the last label to draw. |
||||||
A2D_SCALEFREQ_END_...=0 |
A2D_SCALEFREQ_END_...=1 |
|||||
1000 |
||||||
900 |
900 |
|||||
800 |
800 |
|||||
700 |
700 |
|||||
600 |
600 |
|||||
500 |
500 |
|||||
400 |
400 |
|||||
When A2D_SCALEFREQ_... is non-zero, labels are divided into groups (# of labels divided by A2D_SCALEFREQ_...+1) and A2D_SCALEFREQ_END_... specifies the last group to draw: |
||||||
A2D_SCALEFREQ_...=1 |
A2D_SCALE_FREQ_...=1 |
|||||
1000 |
||||||
800 |
800 |
|||||
600 |
600 |
|||||
400 |
400 |
|||||
Type: |
INT16 |
|||||
Valid Range: |
Zero to the number of labels in the graph or label groups (grouped by A2D_SCALEFREQ_...) |
|||||
Default: |
Zero |
|||||
Example: |
INT16 nOne = 1; |
|||||
Notes: |
A2D_SCALEEND_... also affects the A2D_SCALEFREQ_... attribute. |
|||||
Also See: |
A2D_SCALE_..., A2D_SCALEBASE, A2D_SCALEEND_..., A2D_SCALEFREQ_BEG_..., A2D_SCALEFREQ_... |
|||||
Usage |
ObjectID |
SeriesID |
GroupID |
GraphTypes |
||
Requirements: |
No |
No |
No |
A2D_SCALEFREQ_END_X: |
||
Scatter, Polar, Bubble, & Histogram |
||||||
A2D_SCALEFREQ_END_Y1: |
||||||
All except Pie, 3D Riser, 3D Scatter, and Table |
||||||
A2D_SCALEFREQ_END_Y2: |
||||||
Dual-Axes and BI-Polar Only |
||||||
A2D_SCALEFREQ_END_Y3/Y4: |
||||||
Bar, Line, Area, Stock, & Scatter |
||||||
A2D_SCALEFREQ_O1/O2
These attributes are used to specify the frequency at which group labels are displayed on an ordinal (text-based) axes. By specifying the number of data groups included with one label, you can display "every other label", "every 3rd label", etc. This function is useful when you have many groups and want to create a less cluttered appearance by eliminating some of the group labels. |
||||||
The classic example is a graph in which there is a group for each month of the year. If you set this attribute to "3", the system will only display every third label. The group labels (e.g., months) are divided into sets of three and one label from each set (e.g. January, April, July, October) is displayed. When this attribute is not used or set to the default value (0), the first label in each set is used. |
||||||
Use A2D_SCALEFREQ_BEG_O1/O2 to identify a different label in each group. Although header labels will disappear, data will remain untouched. In this simple example, the audience is well acquainted with the names of months and will easily "fill in the blanks". This feature depends on audience knowledge; omitting labels from a group of random names does not give the audience a chance to fill in the blanks. |
||||||
These attributes affect the O1/O2-axis header labels on all 2D graphs (except circular 2D charts, such as pies, polar, radar, and bubbles). |
||||||
Type: |
INT16 |
|||||
Valid Range: |
Any positive integer, less than or equal to the total number of headers. |
|||||
1= |
Every label is displayed |
|||||
2= |
Every other label is displayed. A2D_SCALEFREQ_BEG_O1/O2 determines whether the first or second header of each set is displayed. |
|||||
2...n= |
The label headers are divided into sets according to this value. Only one label is displayed from each set. Use A2D_SCALEFREQ_BEG_O1/O2 to specify which label in each set will be displayed. When the A2D_SCALEFREQ_BEG_O1/O2 is not used or set to the default value (0), the first label in each set is displayed. |
|||||
Default: |
0 (zero) |
|||||
Example: |
static int SkipFreq[3] = {1,2,3}; |
|||||
Also See: |
A2D_SCALEFREQ_BEG_O1/O2, A2D_SCALEFREQ_END_O1/O2 |
|||||
Usage |
ObjectID |
SeriesID |
GroupID |
GraphTypes |
||
Requirements: |
No |
No |
No |
A2D_SCALEFREQ_O1: |
||
Bar, Line, Area |
||||||
A2D_SCALEFREQ_O2: |
||||||
Spectral Maps ONLY |
||||||
A2D_SCALEFREQ_X/Y1/Y2/Y3/Y4
These attributes control the frequency at which labels are displayed on a numeric axis. It is used in conjunction with A2D_SCALEFREQ_BEG_... and A2D_SCALEFREQ_END_... to limit the number of labels on the axis. Note that these attributes do not affect axis gridlines -- gridlines are drawn even if the associated label has been skipped by an A2D_SCALEFREQ_... attribute. |
||||||
Type: |
INT16 |
|||||
Valid Range: |
Any positive integer, less than or equal to the total number of labels. |
|||||
0= |
Draw every label |
|||||
1...n= |
Divide the labels into groups of n+1. A2D_SCALEFREQ_BEG_... determines which label in each group is drawn (default = first label in each group). |
|||||
Default: |
Zero |
|||||
Example: |
INT16 = nOne; |
|||||
Also See: |
A2D_SCALEFREQ_BEG_..., A2D_SCALEFREQ_END_..., A2D_SCALEEND_... |
|||||
Usage |
ObjectID |
SeriesID |
GroupID |
GraphTypes |
||
Requirements: |
No |
No |
No |
A2D_SCALEFREQ_END_X: |
||
Scatter, Polar, Bubble, & Histogram |
||||||
A2D_SCALEFREQ_END_Y1: |
||||||
All except Pie, 3D Riser, 3D Scatter, and Table |
||||||
A2D_SCALEFREQ_END_Y2: |
||||||
Dual-Axes and BI-Polar Only |
||||||
A2D_SCALEFREQ_END_Y3/Y4: |
||||||
Bar, Line, Area, Stock, & Scatter |
||||||
This attribute specifies the calculation method (scientific or financial) that will be used to draw a moving average curve (O2D_MOVAVGLINE) when it is enabled by the A2D_SDLINEMOVEA attribute. |
||||||
Type: |
BOOLEAN16 |
|||||
Valid Range: |
TRUE/FALSE |
|||||
TRUE= |
Use "Scientific" moving average |
|||||
FALSE= |
Use "Financial" moving average |
|||||
Default: |
FALSE |
|||||
Example: |
//Series ID for the stat line |
|||||
Notes: |
The A2D_SDLINEMOVA attribute controls whether or not this line is drawn. The A2D_CURVEMOVING object controls the number of points used to generate the line. |
|||||
Also See: |
||||||
Usage |
ObjectID |
SeriesID |
GroupID |
GraphTypes |
||
Requirements: |
No |
No |
No |
Bar, Line, Area, Scatter, Bubble, Stock, Histogram |
||
This attribute enables/disables the display of data text (e.g., values on risers) for a particular series. |
||
Type: |
typedef struct _TDG_SerDepBOOLEAN16 { |
|
Valid Range: |
nSeriesID: Selects the series for which data text is to be drawn or not drawn. |
|
bValue: TRUE/FALSE |
||
TRUE= |
Show data text for nSeriesID |
|
FALSE= |
Don't show data text for nSeriesID |
|
Default: |
None |
|
Also See: |
A2D_FORMATDTXT_X/_Y1/_Y2_/Y3_/Y4, A2D_SHOW_DATATEXT |
On line and 2-D scatter charts, this series-dependent attribute determines if the marker, line, or both are drawn. |
|||||||
Type: |
typedef struct _TDG_SerDepINT16 { |
||||||
Valid Range: |
nSeriesID: Series ID |
||||||
nValue: 0...2 |
|||||||
#define |
Value |
Description |
|||||
DATALINE_BOTH |
0 |
Draw Markers and Lines |
|||||
DATALINE_MARKER |
1 |
Draw marker only |
|||||
DATALINE_LINE |
2 |
Draw line only |
|||||
Default: |
DATALINE_BOTH |
||||||
Example: |
TDG_SerDepINT16 thisline; |
||||||
|
|||||||
Notes: |
This attribute must be set after setting A_GRAPH_PRESET. A_GRAPH_PRESET sets all series dependent data lines to "0" (both). |
||||||
Usage |
ObjectID |
SeriesID |
GroupID |
GraphTypes |
|||
Requirements: |
No |
Yes, specify in nSeriesID |
No |
Bar, Line, Area, Scatter, Bubble, Stock, Histogram |
|||
This attribute is used to emphasize one or more series (of risers, data markers, or area risers) in a graph by making their graph type look different from the other series. It allows you to represent individual series data with a line or area representation in a bar graph, with a bar or area riser in a line graph, or with a line or bar in an area graph. As an example, assume you want to emphasize the series one data markers in a line graph. When A2D_SDEMPHASIZED is used, the series one data markers can be represented as bars or areas. The method of emphasis is different depending on the graph type as shown on the following table |
||||||
Type: |
INT16 |
|||||
Valid Range: |
0...2 |
|||||
0= |
No emphasis. Data representations in a bar graph are bars. Data representations in a line graph are lines. Data representations in an area graph are area risers. |
|||||
1= |
The specified series in a bar graph is represented by lines. The specified series in a line graph is represented by a bar riser. The specified series in an area graph is represented by lines. |
|||||
2= |
The specified series in a bar graph is represented by an area riser. The specified series in a line graph is represented by an area riser. The specified series area graph is represented by a bar riser |
|||||
Default: |
0 (No emphasis) |
|||||
Example: |
nSeriesID = 2; |
|||||
|
||||||
Usage |
ObjectID |
SeriesID |
GroupID |
GraphTypes |
||
Requirements: |
No |
Yes |
No |
Bar, Line, Area, Scatter, Bubble, Stock, Histogram |
||
When enabled, this attribute draws a connected line along a specified series on any 2D graph (except Pies and Spectral Maps). This line, like all curve types, is Series Dependent -- you must specify the ID of the series that the line connects. |
||||||
Type: |
BOOLEAN16 |
|||||
Valid Range: |
TRUE/FALSE |
|||||
TRUE= |
Draw a connected line for this series |
|||||
FALSE |
Don't draw a connected line for this series |
|||||
Default: |
FALSE |
|||||
Example: |
nSeriesID = 2; |
|||||
|
||||||
Also See: |
||||||
Usage |
ObjectID |
SeriesID |
GroupID |
GraphTypes |
||
Requirements: |
No |
Yes |
No |
Bar, Line, Area, Scatter, Bubble, Stock, Histogram |
||
When enabled, this attribute draws a smooth curve line for a specified series. Like all curve types, this line is Series Dependent - it specifies the series of data representations across which the curved line is drawn. The number of points to be used in calculating the curve is specified by the A2D_CURVESMOOTH attribute. A2D_SDLINECURV affects the O2D_CURVE object. |
||||||
Type: |
BOOLEAN16 |
|||||
Valid Range: |
TRUE/FALSE |
|||||
TRUE= |
Draw a smooth curve line for this series |
|||||
FALSE |
Don't draw a smooth curve line for this series |
|||||
Default: |
FALSE |
|||||
Example: |
nSeriesID = 2; |
|||||
|
||||||
Also See: |
||||||
Usage |
ObjectID |
SeriesID |
GroupID |
GraphTypes |
||
Requirements: |
No |
Yes |
No |
Bar, Line, Area, Scatter, Bubble, Stock, Histogram |
||
This attribute enables/disables the display of the correction coefficient used when linear regression, exponential regression, common log regression, natural log regression and polynomial fit lines are enabled and drawn. |
||||||
Type: |
BOOLEAN16 |
|||||
Valid Range: |
TRUE/FALSE |
|||||
TRUE= |
Draw Correction Coefficient |
|||||
FALSE |
Don't draw |
|||||
Default: |
FALSE |
|||||
Example: |
nSeriesID = 2; |
|||||
|
||||||
Notes: |
Use A2D_LOCATE_LINR_TEXT to position this text object anywhere in the graph frame. |
|||||
Also See: |
A2D_SDLINELINR_EXP, A2D_SDLINELINR_LOG, A2D_SDLINELINR_NATLOG, A2D_SDLINELINR_NPOLY, A2D_LOCATE_LINR_TEXT |
|||||
Usage |
ObjectID |
SeriesID |
GroupID |
GraphTypes |
||
Requirements: |
No |
Yes |
No |
Bar, Line, Area, Scatter, Bubble, Stock, Histogram |
||
This attribute enables/disables drawing of an exponential linear regression line for a specified series. It is calculated using the following formula: |
||||||
y = a*b**x |
||||||
This line, like all curve types, is Series Dependent - the SeriesID identifies the series across which the line is drawn. Therefore, the value for the exponential regression is calculated from the values of all data elements that are in this series. |
||||||
Type: |
BOOLEAN16 |
|||||
Valid Range: |
TRUE/FALSE |
|||||
TRUE= |
Draw exponential linear regression line |
|||||
FALSE |
Don't draw |
|||||
Default: |
FALSE |
|||||
Example: |
nSeriesID = 2; |
|||||
|
||||||
Notes: |
See A2D_SDLINELINR_CORR or A2D_SDLINELINR_FORMULA if you want to draw the correction coefficient or formula text associated with this line. |
|||||
Also See: |
||||||
Usage |
ObjectID |
SeriesID |
GroupID |
GraphTypes |
||
Requirements: |
No |
Yes |
No |
Bar, Line, Area, Scatter, Bubble, Stock, Histogram |
||
This attribute enables/disables the display of the formula used when linear regression, exponential regression, common log regression, natural log regression and polynomial fit lines are enabled and drawn. |
||||||
Type: |
BOOLEAN16 |
|||||
Valid Range: |
TRUE/FALSE |
|||||
TRUE= |
Show Formula |
|||||
FALSE |
Don't show formula |
|||||
Default: |
FALSE |
|||||
Example: |
nSeriesID = 2; |
|||||
|
||||||
Notes: |
Use A2D_LOCATE_LINR_TEXT to position this text object anywhere in the graph frame. |
|||||
Also See: |
A2D_SDLINELINR_EXP, A2D_SDLINELINR_LOG, A2D_SDLINELINR_NATLOG, A2D_SDLINELINR_NPOLY, A2D_LOCATE_LINR_TEXT |
|||||
Usage |
ObjectID |
SeriesID |
GroupID |
GraphTypes |
||
Requirements: |
No |
Yes |
No |
Bar, Line, Area, Scatter, Bubble, Stock, Histogram |
||
This attribute enables/disables drawing of a linear regression line for a specified series. This line, like all curve types, is Series Dependent - the SeriesID specifies the series across which the line is drawn. Therefore, the value for the linear regression is calculated from the values of all data elements that are in this series. |
||||||
Type: |
BOOLEAN16 |
|||||
Valid Range: |
TRUE/FALSE |
|||||
TRUE= |
Show linear regression line |
|||||
FALSE |
Don't show linear regression line |
|||||
Default: |
FALSE |
|||||
Example: |
nSeriesID = 2; |
|||||
|
||||||
Notes: |
See A2D_SDLINELINR_CORR or A2D_SDLINELINR_FORMULA if you want to draw the correction coefficient or formula text associated with this line. |
|||||
Also See: |
||||||
Usage |
ObjectID |
SeriesID |
GroupID |
GraphTypes |
||
Requirements: |
No |
Yes |
No |
Bar, Line, Area, Scatter, Bubble, Stock, Histogram |
||
This attribute enables/disables drawing of a common log regression line for a specified series. It is calculated using the formula: |
||||||
y = a*x**b |
||||||
This line, like all curve types, is Series Dependent - the line is drawn across a specified series. Therefore, the value for the common log regression is calculated from the values of all data elements that are in this series. |
||||||
Type: |
BOOLEAN16 |
|||||
Valid Range: |
TRUE/FALSE |
|||||
TRUE= |
Show common log regression line |
|||||
FALSE |
Don't show common log regression line |
|||||
Default: |
FALSE |
|||||
Example: |
nSeriesID = 2; |
|||||
|
||||||
Notes: |
See A2D_SDLINELINR_CORR or A2D_SDLINELINR_FORMULA if you want to draw the correction coefficient or formula text associated with this line. |
|||||
Also See: |
||||||
Usage |
ObjectID |
SeriesID |
GroupID |
GraphTypes |
||
Requirements: |
No |
Yes |
No |
Bar, Line, Area, Scatter, Bubble, Stock, Histogram |
||
This attribute enables/disables drawing of a natural log linear regression line for a specified series. The linear regression line is calculated as follows: |
||||||
y = a*log(x) + b |
||||||
This line, like all curve types, is Series Dependent - the line is drawn across a specified series. Therefore, the value for the natural log regression is calculated from the values of all data elements that are in this series. |
||||||
Type: |
BOOLEAN16 |
|||||
Valid Range: |
TRUE/FALSE |
|||||
TRUE= |
Show natural log regression line |
|||||
FALSE |
Don't show natural log regression line |
|||||
Default: |
FALSE |
|||||
Example: |
nSeriesID = 2; |
|||||
|
||||||
Notes: |
See A2D_SDLINELINR_CORR or A2D_SDLINELINR_FORMULA if you want to draw the correction coefficient or formula text associated with this line. |
|||||
Also See: |
||||||
Usage |
ObjectID |
SeriesID |
GroupID |
GraphTypes |
||
Requirements: |
No |
Yes |
No |
Bar, Line, Area, Scatter, Bubble, Stock, Histogram |
||
This attribute enables/disables drawing of a polynomial fit line for a specified series. It is calculated using the following formula: |
||||||
y = a + b*x + b*x**2 |
||||||
This line, like all curve types, is Series Dependent - the line is drawn across a specified series. Therefore, the value for the polynomial fit is calculated from the values of all data elements that are in this series. |
||||||
Type: |
BOOLEAN16 |
|||||
Valid Range: |
TRUE/FALSE |
|||||
TRUE= |
Show polynomial fit line |
|||||
FALSE |
Don't show polynomial fit line |
|||||
Default: |
FALSE |
|||||
Example: |
nSeriesID = 2; |
|||||
|
||||||
Notes: |
See A2D_SDLINELINR_CORR or A2D_SDLINELINR_FORMULA if you want to draw the correction coefficient or formula text associated with this line. See A2D_SDLINELINR_NPOLYFAC to set the degree of linear regression used in the calculation for this line. |
|||||
Also See: |
A2D_SDLINELINR_CORR, A2D_SDLINELINR_FORMULA, A2D_SDLINELINR_NPOLYFAC |
|||||
Usage |
ObjectID |
SeriesID |
GroupID |
GraphTypes |
||
Requirements: |
No |
Yes |
No |
Bar, Line, Area, Scatter, Bubble, Stock, Histogram |
||
This attribute specifies the degree of linear regression for the polynomial fit line. The polynomial fit line is drawn by A2D_SDLINELINR_NPOLY. |
|||||
Type: |
INT16 |
||||
Valid Range: |
1 to the number of groups in the graph |
||||
Default: |
1 |
||||
Example: |
nSeriesID = 2; |
||||
|
|||||
Notes: |
If A2D_SDLINR_NPOLYFAC is set to less than one, it will be reset to 1. If it is set to greater than the number of groups, it will be reset to exactly the number of groups in the graph. |
||||
Also See: |
|||||
Usage |
ObjectID |
SeriesID |
GroupID |
GraphTypes |
|
Requirements: |
No |
Yes |
No |
Bar, Line, Area, Scatter, Bubble, Stock, Histogram |
|
This attribute enables/disables drawing of a mean average line for this series. Like all curve types, it is Series Dependent - the line is drawn for a specific series. Therefore, the value for the mean is calculated from the values of all data elements in the specified series. |
||||||
Type: |
BOOLEAN16 |
|||||
Valid Range: |
TRUE/FALSE |
|||||
TRUE= |
Draw a mean average line for this series |
|||||
FALSE |
Do not draw a mean average line for this series |
|||||
Default: |
FALSE(0) |
|||||
Example: |
nSeriesID = 2; |
|||||
|
||||||
Also See: |
||||||
Usage |
ObjectID |
SeriesID |
GroupID |
GraphTypes |
||
Requirements: |
No |
Yes |
No |
Bar, Line, Area, Scatter, Bubble, Stock, Histogram |
||
This attribute enables/disables drawing of a moving average line for nSeriesID. Like all curve types, it is Series Dependent. Therefore, the value for the moving average is calculated from the values of all data elements in the specified series. |
||||||
Type: |
BOOLEAN16 |
|||||
Valid Range: |
TRUE/FALSE |
|||||
TRUE= |
Draw a moving average line for this series |
|||||
FALSE= |
Do not draw a moving average line for this series |
|||||
Default: |
FALSE (0) |
|||||
Example: |
nSeriesID = 2; |
|||||
|
||||||
Also See: |
||||||
Usage |
ObjectID |
SeriesID |
GroupID |
GraphTypes |
||
Requirements: |
No |
Yes |
No |
Bar, Line, Area, Scatter, Bubble, Stock, Histogram |
||
This attribute enables/disables drawing of a standard deviation line for a specified series. The value for the standard deviation is calculated from the values of all data elements that are in this series. This line, like all curve types, is Series Dependent - hence the name "SDLINE..." |
||||||
Type: |
BOOLEAN16 |
|||||
Valid Range: |
TRUE/FALSE |
|||||
TRUE= |
Draw a standard deviation line for this series. |
|||||
FALSE= |
Do not draw a standard deviation line for this series. |
|||||
Default: |
FALSE(0) |
|||||
Example: |
nSeriesID = 2; |
|||||
|
||||||
Also See: |
||||||
Usage |
ObjectID |
SeriesID |
GroupID |
GraphTypes |
||
Requirements: |
No |
Yes |
No |
Bar, Line, Area, Scatter, Bubble, Stock, Histogram |
||
This attribute can be used to draw series labels to the right or left of the chart frame, aligned with the first series marker that matches. |
|||||||
Type: |
INT16 |
||||||
Valid Range: |
One of the following #defines: |
||||||
#define |
Value |
Description |
|||||
0 |
Don't show |
||||||
LABELS_ON_LEFT |
1 |
Series Labels on left side of chart frame |
|||||
LABELS_ON_RIGHT |
2 |
Series Labels on right side of chart frame |
|||||
LABELS_ON_LEFT_AND_RIGHT |
3 |
Series Labels on both sides of chart frame |
|||||
Valid Range: |
INT16: 0...3 |
||||||
Usage |
ObjectID |
SeriesID |
GroupID |
GraphTypes |
|||
Requirements: |
No |
No |
No |
Bar, Line, Area |
|||
This property enables/disables drawing of the girds in a bubble chart that are defined by the A2D_BUBBLEGRID_COUNT and A2D_BUBBLEGRID_POSITION attributes. |
||||||
Type: |
BOOLEAN16 |
|||||
Valid Range: |
TRUE/FALSE |
|||||
TRUE= |
Show grids |
|||||
FALSE= |
Do not show grids |
|||||
Default: |
TRUE |
|||||
Notes: |
This attribute is identical to A2D_SHOW_QUADRANTS |
|||||
Also See: |
A2D_BUBBLEGRID_COUNT_X, A2D_BUBBLEGRID_COUNT_Y, A2D_BUBBLEGRID_POSITION_X, A2D_BUBBLEGRID_POSITION_Y, A2D_SHOW_QUADRANTS |
|||||
Usage |
ObjectID |
SeriesID |
GroupID |
GraphTypes |
||
Requirements: |
No |
No |
No |
Bubble |
||
This attribute determines whether a data value and/or non-numeric text (or neither) will be displayed by a data point. It affects data text and slice values on pies. |
||||||||
Type: |
INT16 |
|||||||
Valid Range: |
One of the following #defines: |
|||||||
#define |
Value |
Description |
||||||
DATATEXT_NONE |
0x00 |
None, do not show values or non-numeric text |
||||||
DATATEXT_VALUE |
0x01 |
Show value(s) of data item(s). |
||||||
DATATEXT_TEXT |
0x02 |
Show unique data item text. |
||||||
DATATEXT_BOTH |
0x03 |
Show values and non-numeric text (DATATEXT_VALUE | DATATEXT_TEXT) |
||||||
DATATEXT_ABS |
0x04 |
Show absolute value in stacked segments. |
||||||
DATATEXT_ABSVALUE |
0x05 |
Show unique data item text and show absolute value in stacked segments (DATATEXT_VALUE | DATATEXT_ABS) |
||||||
DATATEXT_ABSBOTH |
0x07 |
Show values and non-numeric text and show absolute value in stacked segments (DATATEXT_BOTH | DATATEXT_ABS) |
||||||
DATATEXT_TOTAL |
0x08 |
Total value on top of the stacked bar. |
||||||
DATATEXT_ZVALUE |
0x10 |
Display the Z-value in bubble charts. |
||||||
DATATEXT_PERCENT |
0x20 |
Calculate and show the riser value as a percentage |
||||||
DATATEXT_YVALUE |
0x40 |
Display the Y-value in scatter or bubble charts |
||||||
DATATEXT_INTERNAL |
0x80 |
Reserved for Internal Use |
||||||
DATATEXT_SERIES_DEPENDENT |
0x100 |
Turn on series-dependent mode |
||||||
DATATEXT_QUALITYOBJECT_MODE |
0x200 |
Format Bubble Chart DataLabels in manner consistent with Product Position Chart. Reserved for Future Use. |
||||||
Default: |
DATATEXT_NONE (0) |
|||||||
Notes: |
1. |
DATATEXT_ABS should not be used by itself, it is a flag for stacked bar and percentage charts to show a segments absolute value instead of the running total for the stack. |
||||||
2. |
Use A3D_SHOWTEXT_DATALABELS to display data text labels only in a 3D graph. |
|||||||
Also See: |
A2D_PLACE_O1/_O2, A2D_PLACE_X/_Y1/_Y2/_Y3/_Y4, A2D_FORMATDTXT_X/_Y1/_Y2/_Y3_/Y4, A3D_SHOWTEXT_DATALABELS |
|||||||
Usage |
ObjectID |
SeriesID |
GroupID |
GraphTypes |
||||
Requirements: |
No |
No |
No |
All except Pie |
This attribute enables/disable the display of the line that separates the two halves of a Bi-Polar graph. |
||||||
Type: |
BOOLEAN16 |
|||||
Valid Range: |
TRUE/FALSE |
|||||
TRUE= |
Show the line. |
|||||
FALSE= |
Hide the line. |
|||||
Default: |
TRUE |
|||||
Example: |
SetGraphAttr(gpGraph,GRAPH_LAYER, |
|||||
|
||||||
SetGraphAttr(gpGraph,GRAPH_LAYER, |
||||||
|
||||||
Usage |
ObjectID |
SeriesID |
GroupID |
GraphTypes |
||
Requirements: |
No |
No |
No |
Bar, Line, Area, Scatter, Polar, Radar, Bubble, Stock |
||
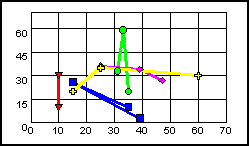
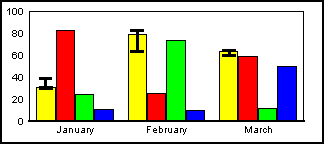
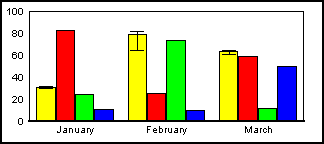
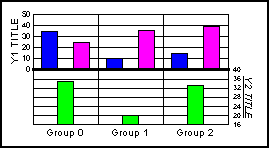
This attribute enables/disables the display of error bars. When error bars are enabled, an I-bar showing the error value range will be superimposed on data representation objects (e.g., risers) that are within the error range. As an example, the following simple bar chart shows the data charted in the first riser is within the error range. |
||||||
Type: |
typedef struct _TDG_SerDepBOOLEAN16 { |
|||||
Valid Range: |
nSeriesID: any valid SeriesID. Identifies the SeriesID of a series in the graph where an error bar is to be shown/not shown. |
|||||
bValue: TRUE/FALSE |
||||||
TRUE= |
Show error bar |
|||||
FALSE= |
Don't show error bar |
|||||
Default: |
nSeriesID = 1, bValue = FALSE |
|||||
Example: |
TDG_SerDepBOOLEAN16 thisError; |
|||||
|
||||||
Notes: |
1. |
You must use A2D_DATAFORMAT and select low and high error values in conjunction with this attribute. A2D_DATAFORMAT specifies the format and type of data from a data source (e.g., spreadsheet). The data source must supply the low/high error range in order for the error bar to be displayed. |
||||
2. |
Use A2D_SIZE_ERRORBARS to change the size of the error bar. |
|||||
Also See: |
||||||
Usage |
ObjectID |
SeriesID |
GroupID |
GraphTypes |
||
Requirements: |
No |
Yes, specify in nSeriesID |
No |
Bar, Line, Area, Scatter, Bubble |
||
This attribute enables/disables drawing of the legend box. It also affects all legend box objects (OSG_LEGEND_TEXT, OSG_LEGEND_MARKER & OSG_LEGEND_LINE). When the legend box is not drawn, neither are its components. |
||||||
Type: |
BOOLEAN16 |
|||||
Valid Range: |
TRUE/FALSE |
|||||
TRUE= |
Show the Legend object |
|||||
FALSE= |
Don't show the Legend object |
|||||
Default: |
TRUE |
|||||
Example: |
/* For Area Graph, turn legend off */ |
|||||
|
||||||
Notes: |
This attribute (as well as many other A2D_SHOW_ attributes) can be used to expedite the drawing process when it is not necessary to see a particular element of a graph. When this attribute is set FALSE, the system skips over all of the code required to image the object, resulting in a faster drawing time. However, note that all associated component objects are also not shown. |
|||||
Also See: |
||||||
Usage |
ObjectID |
SeriesID |
GroupID |
GraphTypes |
||
Requirements: |
No |
No |
No |
All except 3D Riser, Spectral, Histogram, Table |
||
A2D_SHOW_O1/O2
These attributes control the visibility of an ordinal axis base line. In addition to the ordinal axis body, they also affect all ordinal axis gridlines and label objects. |
|||||||
Type: |
INT16 |
||||||
Valid Range: |
One of the following #defines: |
||||||
#define |
Value |
Description |
|||||
0 |
Hide the axis, its gridlines, and its header labels |
||||||
SHOW_AXISLINE |
1 |
Show axis base line |
|||||
SHOW_LABELS |
2 |
Show axis labels |
|||||
SHOW_MAJOR_GRIDLINES |
4 |
Show major gridlines |
|||||
SHOW_MINOR_GRIDLINES |
8 |
Show minor gridlines |
|||||
SHOW_SUPER_GRIDLINES |
16 |
Show super gridlines |
|||||
SHOW_ALL |
31 |
Show the axis, its gridlines, and its header labels |
|||||
Default: |
1 |
||||||
Example: |
INT16 nO1DXGrid = 0; |
||||||
|
|||||||
Notes: |
This attribute (and other A2D_SHOW_ attributes) can be used to expedite the drawing process when it is not necessary to see a particular element in a graph. When this attribute is FALSE, the system skips over the code required to image the object resulting in a faster drawing time. However, all associated component objects are also not shown. |
||||||
Also See: |
A2D_PLACE_O1/O2 |
||||||
Usage |
ObjectID |
SeriesID |
GroupID |
GraphTypes |
|||
Requirements: |
No |
No |
No |
A2D_PLACE_O1: |
|||
Bar, Line, Area, Radar, Stock, and Spectral |
|||||||
A2D_PLACE_O2: |
|||||||
Spectral Maps ONLY |
|||||||
A2D_SHOW_OFFSCALE_X/Y1/Y2/Y3/Y4
These attributes enable/disable the display of values that are out of range by clipping them to fit within the range. When this attribute is enabled (TRUE), values greater than a given range are represented as going off scale. For example, a value of 700 goes beyond the specified range of 250-500, so its bar would go all the way to the top of the chart. When this attribute is disabled (FALSE), only values that fall directly between a given range are displayed (e.g. in the example, the 700 bar would be omitted.) |
||||||
Type: |
INT16 |
|||||
Valid Range: |
0...2 |
|||||
0= |
Only display values that fall between a given range |
|||||
1= |
Display values greater than a given range as going off the scale |
|||||
2= |
Clip Mode |
|||||
Default: |
0 |
|||||
Example: |
setGraphAttr(gpGraph, GRAPH_LAYER, |
|||||
Usage |
ObjectID |
SeriesID |
GroupID |
GraphTypes |
||
Requirements: |
No |
No |
No |
A2D_FORMAT_X: |
||
Scatter, Polar, Bubble, & Histogram |
||||||
A2D_FORMAT_Y1: |
||||||
All except Pie, 3D Riser, 3D Scatter, and Table |
||||||
A2D_FORMAT_Y2: |
||||||
Dual-Axes and BI-Polar Only |
||||||
A2D_FORMAT_Y3/Y4: |
||||||
Bar, Line, Area, Stock, & Scatter |
||||||
This attribute enables/disables drawing of quadrant lines in a bubble chart. Quadrant lines are used in Bubble charts to divide the frame into 4 or more quadrants. |
||||||
Type: |
BOOLEAN16 |
|||||
Valid Range: |
TRUE/FALSE |
|||||
TRUE= |
Show quadrants |
|||||
FALSE= |
Don't show quadrants |
|||||
Default: |
FALSE |
|||||
Notes: |
This attribute is identical to A2D_SHOW_BUBBLEGRID |
|||||
Usage |
ObjectID |
SeriesID |
GroupID |
GraphTypes |
||
Requirements: |
No |
No |
No |
Bubble |
||
This attribute enables/disables drawing of the series/legend title. |
||
Type: |
BOOLEAN16 |
|
Valid Range: |
TRUE/FALSE |
|
TRUE= |
Show series title |
|
FALSE= |
Don't show series title |
|
Default: |
TRUE |
|
A2D_SHOW_TITLE_X/Y1/Y2/Y3/Y4
These attributes enable/disable drawing of the numeric axis titles. |
|||||
Type: |
BOOLEAN16 |
||||
Valid Range: |
TRUE (Draw title) / FALSE (Do not draw title) |
||||
Default: |
TRUE |
||||
Example: |
BOOLEAN16 bIsOn = TRUE; |
||||
|
|||||
BOOLEAN16 bIsOn = TRUE; |
|||||
|
|||||
Notes: |
These attributes (and other A2D_SHOW_ attributes) can be used to expedite the drawing process when it is not necessary to see a particular element in a graph. When this attribute is FALSE, the system skips over the code required to image the object resulting in a faster drawing time. However, all associated component objects are also not shown. |
||||
Usage |
ObjectID |
SeriesID |
GroupID |
GraphTypes |
|
Requirements: |
No |
No |
No |
A2D_SHOW_TITLE_X: |
|
Scatter, Polar, Bubble, & Histogram |
|||||
A2D_SHOW_TITLE_Y1: |
|||||
All except Pie, 3D Riser, 3D Scatter, and Table |
|||||
A2D_SHOW_TITLE_Y2: |
|||||
Dual-Axes and BI-Polar Only |
|||||
A2D_SHOW_TITLE_Y3/Y4: |
|||||
Bar, Line, Area, Stock, & Scatter |
A2D_SHOW_X/Y1/Y2/Y3/Y4
These attributes enable/disable drawing of a numeric axis base line, axis labels, and gridlines. |
|||||||
Type: |
INT16 |
||||||
Valid Range: |
One of the following #defines: |
||||||
#define |
Value |
Description |
|||||
0 |
Hide the axis, its gridlines, and its header labels |
||||||
SHOW_AXISLINE |
1 |
Show axis base line |
|||||
SHOW_LABELS |
2 |
Show axis labels |
|||||
SHOW_MAJOR_GRIDLINES |
4 |
Show major gridlines |
|||||
SHOW_MINOR_GRIDLINES |
8 |
Show minor gridlines |
|||||
SHOW_SUPER_GRIDLINES |
16 |
Show super gridlines |
|||||
SHOW_ALL |
31 |
Show the axis, its gridlines, and its header labels |
|||||
Default: |
TRUE |
||||||
Example: |
INT16 nGridsOnly=2; |
||||||
|
|||||||
Notes: |
This attribute (as well as many other A2D_SHOW_ attributes) can be used to expedite the drawing process when it is not necessary to see a particular element of a graph. When this attribute is set FALSE, the system skips over all of the code required to image the object, resulting in a faster drawing time. However, note that all associated component objects are also not shown. |
||||||
Also See: |
A2D_GRIDLINES_..., A2D_SHOW_ZL_..., A2D_SIDE_... |
||||||
Usage |
ObjectID |
SeriesID |
GroupID |
GraphTypes |
|||
Requirements: |
No |
No |
No |
A2D_SHOW_X: |
|||
Scatter, Polar, Bubble, & Histogram |
|||||||
A2D_SHOW_Y1: |
|||||||
All except Pie, 3D Riser, 3D Scatter, and Table |
|||||||
A2D_SHOW_Y2: |
|||||||
Dual-Axes and BI-Polar Only |
|||||||
A2D_SHOW_Y3/Y4: |
|||||||
Bar, Line, Area, Stock, & Scatter |
A2D_SHOW_ZL_X/Y1/Y2/Y3/Y4
These attributes enable/disable drawing of the zero line on a numeric axis. |
||||||
Type: |
BOOLEAN16 |
|||||
Valid Range: |
TRUE/FALSE |
|||||
TRUE= |
Draw zero line |
|||||
FALSE= |
Do not draw zero line |
|||||
Default: |
TRUE |
|||||
Example: |
SetGraphAttr(gpGraph,GRAPH_LAYER, |
|||||
|
||||||
Notes: |
This attribute (as well as many other A2D_SHOW_ attributes) can be used to expedite the drawing process when it is not necessary to see a particular element of a graph. When this attribute is set FALSE, the system skips over all of the code required to image the object, resulting in a faster drawing time. However, note that all associated component objects are also not shown. |
|||||
Also See: |
A2D_GRIDLINES_..., A2D_SHOW_... |
|||||
Usage |
ObjectID |
SeriesID |
GroupID |
GraphTypes |
||
Requirements: |
No |
No |
No |
A2D_SHOW_X: |
||
Scatter, Polar, Bubble, & Histogram |
||||||
A2D_SHOW_Y1: |
||||||
All except Pie, 3D Riser, 3D Scatter, and Table |
||||||
A2D_SHOW_Y2: |
||||||
Dual-Axes and BI-Polar Only |
||||||
A2D_SHOW_Y3/Y4: |
||||||
Bar, Line, Area, Stock, & Scatter |
||||||
A2D_SIDE_O1/O2
This attribute controls which side of the graph the primary ordinal (O1) axis will be imaged. Although the majority of all graphs will image their ordinal text on the bottom of the graph, it is possible to image it to the top or both sides. |
|||||||
Type: |
INT16 |
||||||
Valid Range: |
A value from the SideType enum: |
||||||
SideType |
Value |
Description |
|||||
LowSide |
0 |
Image to low side of graph (bottom or left). |
|||||
HighSide |
1 |
Image to high side of graph (top or right). |
|||||
BothSides |
2 |
Image to both sides. |
|||||
NeitherSide |
3 |
Don't Image |
|||||
Default: |
LowSide(0) |
||||||
Example: |
INT16 nSide = HighSide; |
||||||
|
|||||||
Also See: |
A2D_SHOW_O1/_O2 |
||||||
Usage |
ObjectID |
SeriesID |
GroupID |
GraphTypes |
|||
Requirements: |
No |
No |
No |
A2D_SIDE_O1: |
|||
Bar, Line, Area, Radar, Stock, and Spectral |
|||||||
A2D_SIDE_O2: |
|||||||
Spectral Maps ONLY |
|||||||
A2D_SIDE_X/Y1/Y2/Y3/Y4
These attributes control which side of the graph a numeric axis will be imaged. |
|||||||
Type: |
INT16 |
||||||
Valid Range: |
A value from the SideType enum: |
||||||
SideType |
Value |
Description |
|||||
LowSide |
0 |
Image to low side of graph (bottom or left). |
|||||
HighSide |
1 |
Image to high side of graph (top or right). |
|||||
BothSides |
2 |
Image to both sides. |
|||||
NeitherSide |
3 |
Don't Image |
|||||
Default: |
LowSide(0) |
||||||
Example: |
INT16 nSide = HighSide; |
||||||
|
|||||||
Also See: |
A2D_SHOW_... |
||||||
Usage |
ObjectID |
SeriesID |
GroupID |
GraphTypes |
|||
Requirements: |
No |
No |
No |
A2D_SIDE_X: |
|||
Scatter, Polar, Bubble, & Histogram |
|||||||
A2D_SIDE_Y1: |
|||||||
All except Pie, 3D Riser, 3D Scatter, and Table |
|||||||
A2D_SIDE_Y2: |
|||||||
Dual-Axes and BI-Polar Only |
|||||||
A2D_SIDE_Y3/Y4: |
|||||||
Bar, Line, Area, Stock, & Scatter |
|||||||
This attribute sets the size (width) of the error bar "tails". It affects error bar objects on bar and scatter risers in Bar and Scatter type graphs. |
|||||
Type: |
INT16 |
||||
Valid Range: |
0 to 2000 expressed in TDG virtual coordinates. |
||||
Default: |
0 (zero) |
||||
Example: |
//Make error bar larger |
||||
|
|||||
Also See: |
|||||
Usage |
ObjectID |
SeriesID |
GroupID |
GraphTypes |
|
Requirements: |
No |
No |
No |
Bar, Line, Area, Scatter, Bubble |
|
This is a series dependent attribute. It determines whether the given series belongs to the Y1 axis or the Y2 axis. |
||||||
Type: |
typedef struct _TDG_SerDepBOOLEAN16 { |
|||||
Valid Range: |
nSeriesID: any valid Series ID: Specifies the series to be located on the Y1 or Y2 axis |
|||||
bValue: TRUE/FALSE |
||||||
TRUE= |
This series belongs to the Y2-axis |
|||||
FALSE= |
This series belongs to the Y1-axis |
|||||
Default: |
FALSE(0) |
|||||
Example: |
struct _TDG_SerDepBOOLEAN16 whichAxis; |
|||||
|
||||||
Also See: |
||||||
Usage |
ObjectID |
SeriesID |
GroupID |
GraphTypes |
||
Requirements: |
No |
Yes, specify in nSeriesID |
No |
Bar, Line, Area, Scatter, Polar, Radar, Bubble, Stock |
||
In Bi-Polar charts, a line is drawn in the center chart to split to two halves (Y1 and Y2) of the chart. This attribute can be used to change the location of the dual-axes split line. For example, set this property to 75 to assign 75% of the chart frame for the Y1 axis and 25% for the Y2 axis. |
|||||
Type: |
INT16 |
||||
Valid Range: |
0...100 |
||||
Default: |
50 |
||||
Also See: |
|||||
Usage |
ObjectID |
SeriesID |
GroupID |
GraphTypes |
|
Requirements: |
No |
No |
No |
All Bi-Polar |
|
Normally, the rectangle for a marker is locked to the current setting of A2D_INSET_LGND_ICON and takes the same shape as the margin settings for that attribute. When this attribute is TRUE, the legend marker is always forced to a perfect square. The square sits in the center of the rectangle defined by A2D_INSET_LGND_ICON. This attribute affects all legend marker objects (colored icons within the legend) and all 2D graph types. |
||||||
Type: |
BOOLEAN16 |
|||||
Valid Range: |
TRUE/FALSE |
|||||
TRUE= |
Always keep the marker a perfect shape |
|||||
FALSE= |
Use the defined rectangle for marker shape |
|||||
Default: |
TRUE(1) |
|||||
Usage |
ObjectID |
SeriesID |
GroupID |
GraphTypes |
||
Requirements: |
No |
No |
No |
All except 3D Riser, Spectral, Histogram, Table |
||
A2D_STAGGER_O1/O2
This attribute specifies whether or not text on the O1-axis should be staggered. Staggered labels are drawn in a zigzag fashion with labels weaving in and under each other. A2D_STAGGER_O1 affects all primary ordinal axis labels (O2D_O1_LABEL). A2D_STAGGER_O2 affects all secondary ordinal axis labels (O2D_O2_LABEL). |
||||||
Type: |
BOOLEAN16 |
|||||
Valid Range: |
TRUE/FALSE |
|||||
TRUE= |
Stagger the labels on this axis. |
|||||
FALSE= |
Draw them as normal. |
|||||
Default: |
FALSE(0) |
|||||
Example: |
SetGraphAttr(gpGraph,GRAPH_LAYER, |
|||||
|
||||||
Usage |
ObjectID |
SeriesID |
GroupID |
GraphTypes |
||
Requirements: |
No |
No |
No |
A2D_STAGGER_O1: |
||
Bar, Line, Area, Radar, Stock, Spectral, Gantt |
||||||
A2D_STAGGER_O2: |
||||||
Spectral Maps only |
||||||
A2D_STAGGER_X/Y1/Y2/Y3/Y4/Z
These attributes control whether or not labels on a numeric axis are staggered. Staggered labels are drawn in a zigzag fashion with labels weaving in and under each other. A2D_STAGGER_X affects all X1 axis labels (O2D_X1_LABEL). A2D_STAGGER_Y1 affects all Y1 axis labels (O2D_Y1_LABEL). A2D_STAGGER_Y2 affects all Y2 axis labels (O2D_Y2_LABEL). |
||||||
Type: |
BOOLEAN16 |
|||||
Valid Range: |
TRUE/FALSE |
|||||
TRUE= |
Stagger the labels on this axis. |
|||||
FALSE= |
Draw them as normal. |
|||||
Default: |
FALSE(0) |
|||||
Example: |
SetGraphAttr(gpGraph,GRAPH_LAYER, |
|||||
|
||||||
Usage |
ObjectID |
SeriesID |
GroupID |
GraphTypes |
||
Requirements: |
No |
No |
No |
A2D_STAGGER_X: |
||
Scatter, Polar, Bubble, & Histogram |
||||||
A2D_STAGGER_Y1: |
||||||
All except Pie, 3D Riser, 3D Scatter, and Table |
||||||
A2D_STAGGER_Y2: |
||||||
Dual-Axes and BI-Polar Only |
||||||
A2D_STAGGER_Y3/Y4: |
||||||
Bar, Line, Area, Stock, & Scatter |
||||||
A2D_STAGGER_Z: |
||||||
3D Scatter Charts Only |
||||||
This attribute selects a character in the currently specified font that will be used for the series specified by SeriesID. The font itself is determined by the common attribute A_FONTNAME when it is applied to the Data Marker object. This attribute is set to an integer value that corresponds to a character in the font. For example, imagine a very simple font, consisting of the 26 capital letters A-Z. Setting this attribute to "2" would result in a "B". This attribute affects all markers in a line or scatter graph (O2D_DATAMARKER) and Bar/Line/Area and Scatter (XY) charts only. |
|
Type: |
INT16 |
Valid Range: |
zero to the number of characters in the currently selected font. |
Default: |
65 |
This attribute selects one of the following options: 1) borders (edge) colors of all the data risers on this graph have the same color or 2) border colors can be individually set. It affects all border objects around risers and markers and all graph types except pies. |
||||||
Type: |
BOOLEAN16 |
|||||
Valid Range: |
TRUE/FALSE |
|||||
TRUE= |
All risers in the graph share the same border (edge) color. |
|||||
FALSE= |
Each riser can have its own border color assigned, independent of the other borders. |
|||||
Default: |
TRUE |
|||||
Example: |
/* Let risers have different border colors */ |
|||||
Also See: |
||||||
Usage |
ObjectID |
SeriesID |
GroupID |
GraphTypes |
||
Requirements: |
No |
No |
No |
All |
||
This attribute selects one of the following options: 1) all risers on this graph use the same marker shape or 2) each series can have its own, distinct shape. It affects all data risers on the graph (bars and markers) and all graph types except pies. |
||||||
Type: |
BOOLEAN16 |
|||||
Valid Range: |
TRUE/FALSE |
|||||
TRUE= |
All riser (bars and markers) in this graph will have the same shape. |
|||||
FALSE= |
Any series in this graph can have its own shape assigned to it. This is the usual mode for scatter (XY) graphs. |
|||||
Default: |
FALSE |
|||||
Example: |
/* Let risers have different shapes */ |
|||||
|
||||||
Also See: |
||||||
Usage |
ObjectID |
SeriesID |
GroupID |
GraphTypes |
||
Requirements: |
No |
No |
No |
All except Pie charts |
||
A2D_USE_MANUAL_PICTOGRAPH_SCALE
This attribute and the A2D_MANUAL_PICTOGRAPH_SCALE_VALUE attribute allow pictograms to be stacked according to a unit/scale you provide. Use this attribute to enable the use of the value assigned to A2D_MANUAL_PICTOGRAPH_SCALE_VALUE. |
||||||
Type: |
BOOLEAN16 |
|||||
Valid Range: |
TRUE/FALSE |
|||||
TRUE= |
Engine calculates unit/scale. |
|||||
FALSE= |
Engine uses value of A2D_MANUAL_PICTOGRAPH_SCALE_VALUE attribute. |
|||||
Default: |
TRUE |
|||||
Example: |
Assume the chart's Y-axis scale is 0...10,000 and the chart's scale is 0,2000,4000,6000,8000,10000. When this attribute is TRUE, the engine will pick the size of the interval of this scale (2000) as the size of the pictogram unit. So, a bar with a value of 5000 will be represented by 2 1/2 pictogram units. If you want the pictogram unit to be 5000, do the the following: |
|||||
BOOLEAN16 bValue = TRUE; |
||||||
When the chart is drawn, a bar with a value of 5000.0 will be represented by 1 (much larger) pictogram unit. |
||||||
Also See: |
A2D_MANUAL_PICTOGRAPH_SCALE_VALUE, ABA_PICTOGRAPH |
|||||
Usage |
ObjectID |
SeriesID |
GroupID |
GraphTypes |
||
Requirements: |
No |
No |
No |
Side-by-Side Bar Chart Only |
||
This attribute defines the axis on which a user-defined gridline will be drawn by the A2D_USERLINE_SHOW property. The A2D_USERLINE_VALUE identifies the location where the gridline is drawn. |
||
Type: |
INT16 |
|
Valid Range: |
0...2 |
|
0= |
X-Axis |
|
1= |
Y1-Axis |
|
2= |
Y2-Axis |
|
Default: |
0 |
|
Also See: |
||
This attribute enables (TRUE) / disables (FLASE) drawing of a user-defined gridline that is defined by the A2D_USERLINE_AXIS and A2D_USERLINE_VALUE attributes. |
||
Type: |
BOOLEAN16 |
|
Valid Range: |
TRUE/FALSE |
|
TRUE= |
Show the user-defined gridline |
|
FALSE= |
Hide the user-defined gridline |
|
Default: |
TRUE |
|
Also See: |
This attribute defines the location on the axis identified by A2D_USERLINE_AXIS where a user defined gridline will be drawn when A2D_USERLINE_SHOW is TRUE. |
|
Type: |
REAL64 |
Valid Range: |
Any value within the range of the chart |
Default: |
None |
Also See: |
|