|
ATTRIBUTE |
Description |
|
A3D_AUTOFIT |
Autofit entire cube when 3D chart is rotated |
|
A3D_AUTOFIT_DATALABELS |
Autofit Data Labels in a 3D chart |
|
A3D_AUTOFIT_LEGEND |
Autofit Legend in a 3D chart |
|
A3D_AUTOFIT_TEXT |
Autofit Text in a 3D chart |
|
A3D_AUTOSHADE_CUBE |
Auto Shade the 3D cube in a 3D chart |
|
A3D_AUTOSHADE_RISERS |
Auto Shade the 3D risers in a 3D chart |
|
A3D_AXIS_DIVS_X/Y/Z |
Axis Divisions-X, -Y, -Z on cube walls in a 3D chart |
|
A3D_CUSTOMVIEW |
Custom View angle in a 3D chart |
|
A3D_DATAFORMAT |
Data Format of data input to a 3D graph |
|
A3D_FIXED_2D_TEXT |
Fixed 2D Text or 3D appearance sizing in a 3D chart |
|
A3D_FONTBOX |
Font Box definition in a 3D chart |
|
A3D_FONTMARGIN |
Font Margin between text object and its box |
|
A3D_FONTOFFSET |
Font Offset from axis to text object |
|
A3D_FONTSIZE |
Font Size of a text object in a 3D chart |
|
A3D_FONTWIDTH |
Font Width of a 3D text object relative to its height |
|
A3D_FORMAT_X/Y/Z |
Format X-, Y-, and Z-axes labels in a 3D chart |
|
A3D_GLOW_RISER |
Glow Risers in a 3D chart |
|
A3D_GRAPH_BY_WHAT |
Graph By What (series, group, or series & group) |
|
A3D_GRID_FLOOR |
Show/Hide gridlines on 3D cube floor |
|
A3D_GRID_LWALL |
Show/Hide gridlines on 3D cube left wall |
|
A3D_GRID_RISER |
Show/Hide gridlines on 3D risers |
|
A3D_GRID_RWALL |
Show/Hide gridlines on 3D cube right wall |
|
A3D_IGNORE_SERIES |
Ignore Series in a 3D chart |
|
A3D_INSET_LGND_ICON |
Inset Legend Icon in a 3D chart |
|
A3D_INSET_LGND_TEXT |
Inset Legend Text in a 3D chart |
|
A3D_JUSTIFY |
Justifiy 3D text object |
|
A3D_LOCATE_COLTITLE_2D |
Locate 2D column title in a 3D chart |
|
A3D_LOCATE_LEGEND |
Locate Legend in a 3D chart |
|
A3D_LOCATE_LYTITLE_2D |
Locate 2D left Y1-axis title in a 3D chart |
|
A3D_LOCATE_ROWTITLE_2D |
Locate 2D row title in a 3D chart |
|
A3D_LOCATE_RYTITLE_2D |
Locate 2D right Y1-axis title in a 3D chart |
|
A3D_MARKER_SHAPE |
Marker Shape in a 3D chart |
|
A3D_MARKER_SHAPE_DEFAULT |
Marker Shape Default in a 3D chart |
|
A3D_MARKER_SIZE |
Marker Size in a 3D chart |
|
A3D_RESCALE_ON_SUPPRESS |
Rescale On Suppress after visualize attributes |
|
A3D_RISERTHICK |
Riser Thickness of risers in a 3D chart |
|
A3D_SCALEBASE |
Scale Base of netative risers in a 3D chart |
|
A3D_SCALEEND_X/Y/Z |
Scale End on the X-, Y-, and Z-axes in a 3D chart |
|
A3D_SCALEFREQ_X/Y/Z |
Scale Frequency on the X-, Y-, and Z-axes in a 3D chart |
|
A3D_SCALERANGE_X/Y/Z |
Scale Range on the X-, Y-, and Z-axes in a 3D chart |
|
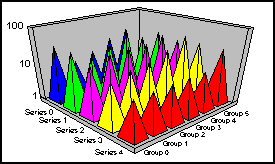
A3D_SCALETYPE_X/Y/Z |
Scale Type (logrithmic or linear) on the X-, Y-, and Z-axes in a 3D chart |
|
A3D_SCATTER_N |
Scatter line connecting markers in a series |
|
A3D_SCATTER_X/Y/Z |
Scatter line from each marker to left wall (X), floor (Y), and right wall (Z) of a 3D cube |
|
A3D_SERIES_TYPE |
Series Type selects riser type for a series or group in a 3D chart |
|
A3D_SHOW_FLOOR |
Show/Hide Floor of the 3D cube |
|
A3D_SHOW_LEGEND |
Show/Hide Legend in a 3D chart |
|
A3D_SHOW_LWALL |
Show/Hide Left Wall of the 3D cube |
|
A3D_SHOW_RWALL |
Show/Hide Right Wall of the 3D cube |
|
A3D_SHOWBOX_DATALABELS |
Show/Hide box around data labels in a 3D chart |
|
A3D_SHOWOFFSCALE_X/Y/Z |
Show/Hide offscale values on the X-, Y-, and Z-axes in a 3D chart |
|
A3D_SHOWTEXT_ALL |
Show/Hide all text in a 3D chart |
|
A3D_SHOWTEXT_COLHEADERS |
Show/Hide Column Headers in a 3D Chart |
|
A3D_SHOWTEXT_COLTITLE |
Show/Hide Column Title in a 3D Chart |
|
A3D_SHOWTEXT_DATALABELS |
Show/Hide Data Labels in a 3D Chart |
|
A3D_SHOWTEXT_LEFTNUMBERS |
Show/Hide labels next to left wall of 3D cube |
|
A3D_SHOWTEXT_LEFTTITLE |
Show/Hide title next to left wall of 3D cube |
|
A3D_SHOWTEXT_RIGHTNUMBERS |
Show/Hide labels next to right wall of 3D cube |
|
A3D_SHOWTEXT_RIGHTTITLE |
Show/Hide title next to right wall of 3D cube |
|
A3D_SHOWTEXT_ROWHEADERS |
Show/Hide row headers in a 3D chart |
|
A3D_SHOWTEXT_ROWTITLE |
Show/Hide Row Title in a 3D chart |
|
A3D_SQUARE_LGND_ICONS |
Square Legend Icons in a 3D chart |
|
A3D_SUPPRESS_RISER |
Suppress Riser(s) in a 3D chart |
|
A3D_SYMBOL_FORSERIES |
Symbol For Series in a 3D chart |
|
A3D_TEXT_POSITION |
Text Position in a 3D chart |
|
A3D_TEXT_QUALITY |
Text Quality of headers, titles, and labels in a 3D chart |
|
A3D_TRANS_RISER |
Transparent Riser(s) in a 3D chart |
|
A3D_UNIFORM_QDRSHAPES |
Uniform Quantative Data Representation (Riser) Shapes |
|
A3D_VIEWANGLES |
Viewing Angles of the 3D cube |
|
A3D_VIEWSTRUCT |
Viewing Structure definition |
| |
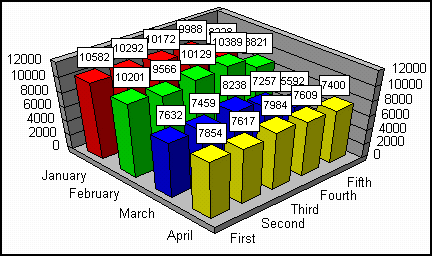
When a 3D graph is rotated, this attribute determines whether the entire cube should be auto-fitted to the bounds of the screen when the 3D text is taken into consideration. This is different from the various 2D auto-fit attributes. This mode operates on the entire graph cube and all attached text. It essentially zooms the graph down in size until it is small enough so that all attached text will fit on screen, then redraws it. |
|
Type: |
INT16 |
|
Valid Range: |
0/1 |
| |
0= |
Do not auto-fit the cube; use the completely defined 3D matrix for imaging. |
| |
1= |
Auto-fit cube; adjust the ZOOM field in the 3D matrix so that the entire graph, including the text (any of the three modes) fits within the Draw Environment. |
|
Default: |
Zero |
|
Example: |
BOOLEAN bTRUE; /* enable autofitting */
SetGraphAttr(gpGraph,GRAPH_LAYER,
NULL_OBJECTID,NULL_SERIESID, NULL_GROUPID,
A3D_AUTOFIT, (void FAR *) &bTRUE); |
|
Notes: |
This attribute affects the entire 3D graph cube and text (everything except Title, Subtitle, and Footnote). If this attribute is set (1), the application must call DrawTheGraph() or DryRunTheGraph() in order for the automatic fitting attribute to be recognized. |
|
Also See: |
A3D_AUTOFIT_DATALABELS, A3D_AUTOFIT_LEGEND, A3D_AUTOFIT_TEXT |
|
Usage |
ObjectID |
SeriesID |
GroupID |
GraphTypes |
|
Requirements: |
No |
No |
No |
3D Riser, 3D Scatter |
| |
|
| |
In 3D Scatter charts, this attribute enables/disables automatic fitting of data text labels that may be drawn next to data markers. When enabled (1), the data text labels are automatically fitted (scaled) to accommodate the size and location of the 3D cube. The application cannot change the size of the labels when automatic fitting is enabled. Font-sizing attributes are ignored. When disabled (0), the application can change the size of the data text labels which may result in them overlapping other objects in the graph. |
|
Type: |
INT16 |
|
Valid Range: |
0/1 |
| |
0= |
Application can manually adjust size of labels |
| |
1= |
Automatically adjust size of data labels |
|
Default: |
Zero |
|
Example: |
TDG_GraphPresetInfo GraphTable [4] = {
{TDG_GRAPH_BARS ,8},{TDG_GRAPH_LINES,0},
{TDG_GRAPH_AREA ,4},{TDG_GRAPH_3D, 16 }};
nGraphType = 3;
/* data format for X, Y, Z, Labels */
SetGraphAttrSL(gpGraph, NULL,
A3D_DATAFORMAT, (void FAR *) &three);
/* Turn on the data text labels */
SetGraphAttrSL(gpGraph, NULL,
A3D_SHOWTEXT_DATALABELS, (void FAR *) &bTRUE);
/* Enable autofitting of data text labels */
SetGraphAttr(gpGraph, GRAPH_LAYER,
NULL_OBJECTID, NULL_SERIESID,NULL_GROUPID,
A3D_AUTOFIT_DATALABELS, &one);
/* Select the 3D Scatter Graph Type */
SetGraphAttr(gpGraph, GRAPH_LAYER,
NULL_OBJECTID, NULL_SERIESID,NULL_GROUPID,
A_GRAPH_PRESET,(void FAR *)&GraphTable[nGraphType]); |
|
Notes: |
When this attribute is set (1), it essentially disables the font-sizing attribute (A_FONTSIZE_VC) for the data text labels in a 3D-scatter graph. Data text labels can still overlap other objects depending on the number and size of data text labels in the graph. Also, note that data text in a 3D Scatter chart does not include QDR (Quantitative Data Representation) values. It is data text labels only. See A3D_DATAFORMAT and A3D_SHOWTEXT_DATALABELS for more information. |
|
Also See: |
A_FONTSIZE_VC, A3D_AUTOFIT, A3D_DATAFORMAT, A3D_SHOWTEXT_DATALABELS |
|
Usage |
ObjectID |
SeriesID |
GroupID |
GraphTypes |
|
Requirements: |
No |
No |
No |
3D Riser, 3D Scatter |
| |
This attribute enables/disables automatic fitting of text inside the legend box in a 3D chart. When automatic fitting is enabled (the default), the font size of these objects cannot be changed to a size that is larger than the relative location and size of the object and objects around it. When automatic fitting is disabled, the font size can be set to any value allowing very large font sizes to overlap other objects in the graph. |
|
Type: |
BOOLEAN16 |
|
Valid Range: |
TRUE/FALSE |
| |
TRUE= |
Automatically fit text in the legend box |
| |
FALSE= |
Do not auto-fit text in the legend box |
|
Default: |
TRUE |
|
Example: |
/* User entered font size */
dFontSize = atoi (TempBuf);
/* if user selects a reasonable size, remove autofit */
if (dFontSize < 16)
SetGraphAttrSI( gpGraph, gpSelItem,
A3D_AUTOFIT_LEGEND, (void FAR *) &bFALSE);
/* Convert from device to virtual coordinates */
vFontSize = dvScaleHeight (gpDrawEnv,dFontSize);
/* Set the user entered font size */
SetGraphAttrSI(gpGraph,gpSelItem,
A_FONTSIZE_VC, &vFontSize); |
|
Notes: |
When this attribute is enabled, font size changes are ignored. The system continues to automatically fit the text regardless of the setting of A_FONTSIZE_VC. Your user interface should gray-out font size menu selections when this attribute is enabled. If you want to use this attribute to determine the approximate font size and then allow the user to modify point size within best-fit limits, include the following steps in your application: |
| |
1. |
Set A3D_AUTOFIT_LEGEND to TRUE |
| |
2. |
Execute DryRunTheGraph() |
| |
3. |
Use GetGraphAttr() to determine the font size that was used with auto-fit enabled |
| |
4. |
Set A3D_AUTOFIT_LEGEND to FALSE |
|
Also See: |
A_FONTSIZE_VC, A3D_AUTOFIT |
|
Usage |
ObjectID |
SeriesID |
GroupID |
GraphTypes |
|
Requirements: |
No |
No |
No |
3D Scatter |
| |
This attribute enables/disables automatic shading of the 3D cube. |
|
Type: |
BOOLEAN16 |
|
Valid Range: |
TRUE/FALSE |
| |
TRUE= |
Automatically shade the 3D cube |
| |
FALSE= |
Do not automatically shade the 3D cube |
|
Default: |
FALSE |
|
Example: |
BOOLEAN bTRUE = TRUE;
SetGraphAttr ( gpGraph, GRAPH_LAYER,
NULL_OBJECTID, NULL_SERIESID,NULL_GROUPID,
A3D_AUTOSHADE_CUBE, (void FAR *) &bTRUE); |
| |
|
| |
BOOLEAN bFALSE = FALSE;
SetGraphAttr ( gpGraph, GRAPH_LAYER,
NULL_OBJECTID, NULL_SERIESID,NULL_GROUPID,
A3D_AUTOSHADE_CUBE, (void FAR *) &bFALSE); |
| |
|
|
Notes: |
When automatic shading is enabled, changing the color of any cube section will affect the color of all other cube sections. Normally the cube floor should be the object selected since it receives 100% of the color. All other sections receive a smaller percentage of the selected color. |
|
Also See: |
A3D_AUTOSHADE_RISERS |
|
Usage |
ObjectID |
SeriesID |
GroupID |
GraphTypes |
|
Requirements: |
No |
No |
No |
3D Riser, 3D Scatter |
| |
This attribute controls the custom viewing angle of a 3D graph. Each FunctionCode value changes the viewing angle by StepSize. By issuing successive calls to CUSTOMVIEW and then redrawing the cube, new viewing angles can be created. |
|
Type: |
typedef struct {
INT16 FunctionCode;
INT16 StepSize;
} TDG_CustomView [, FAR * TDG_CustomViewPtr;] |
|
Valid Range: |
See the TDG_CustomView structure in Appendix A |
|
Default: |
Zero |
|
Example: |
static TDG_CustomView CV_Relative = {26,1};
SetGraphAttrSL (gpGraph,NULL,
A3D_CUSTOMVIEW,(void FAR *) &CV_Relative); |
|
Notes: |
1. |
The system creates a data structure that defines the current viewing angle/position selected by this attribute. The GetGraphAttr() function does not provide access to this information. Instead, the current A3D_CUSTOMVIEW can be saved and restored using the A3D_VIEWSTRUCT attribute. |
| |
2. |
The A3D_CUSTOMVIEW, A3D_VIEWANGLES and A3D_VIEWSTRUCT attributes can be used together to create, save, and restore a particular graph loop. Use A3D_VIEWANGLES to select a predefined angle/look. Use A3D_CUSTOMVIEW to modify the viewing angle, as necessary. Use GetGraphAttr (...,A3D_VIEWSTRUCT, ...) to save the viewing angle created by A3D_VIEWANGLES and A3D_CUSTOMVIEW. Use SetGraphAttr (...,A3D_VIEWSTRUCT,...) to restore the saved view. |
|
Also See: |
A3D_VIEWANGLES, A3D_VIEWSTRUCT |
|
Usage |
ObjectID |
SeriesID |
GroupID |
GraphTypes |
|
Requirements: |
No |
No |
No |
3D Riser, 3D Scatter |
| |
|
| |
This attribute specifies the number of values that the graphics engine will request from a data source (e.g., spreadsheet) to describe a data point in a 3D graph. It also determines the format (or usage) of each data item according to the 3D graph type. |
|
Type: |
INT16 |
|
Valid Range: |
Depends on the graph type: |
| |
nMajorType/nMinorType |
INT16 |
Description |
| |
TDG_GRAPH_3D/All except Scatter |
0 |
VALUE |
| |
TDG_GRAPH_3D/Scatter |
2 |
VALUE_X + VALUE_Y + VALUE_Z |
| |
TDG_GRAPH_3D/Scatter |
3 |
VALUE_X + VALUE_Y + VALUE_Z + LABEL |
|
Default: |
0 (zero) |
|
Notes: |
1. |
A3D_DATAFORMAT is an extremely important attribute. If it is not set properly when the graph type is loaded or changed, the results will be unpredictable. Great care must be taken to ensure that the actual arrangement of the data matches the setting of A3D_DATAFORMAT. See the data call back functions in Chapter 4 of the PGSDK Programmer's Manual for more information. |
| |
2. |
Since the data format selection is different for each graph type, a graph type selection (A_GRAPH_PRESET) should also include a data format selection (A3D_DATAFORMAT). |
| |
3. |
Use A3D_SHOWTEXT_DATALABELS to show the labels associated with a data point in a 3D scatter graph when A3_DATAFORMAT "3" is used. Data text values cannot be displayed in a 3D graph. |
|
Also See: |
A_GRAPH_PRESET, A2D_DATAFORMAT, A3D_SHOWTEXT_DATALABELS |
|
Usage |
ObjectID |
SeriesID |
GroupID |
GraphTypes |
|
Requirements: |
No |
No |
No |
3D Riser, 3D Scatter |
| |
|
| |
This attribute determines whether a selected text object (identified by the ObjectID) is sized to give the appearance of perspective in a 3D graph. Use SetGraphAttr() and specify an ObjectID to select a particular text object. Use SetGraphAttrSI() to size the currently selected text object. Use SetGraphAttrSL() to apply this attribute to all text object (if any) in the selection list. |
|
Type: |
BOOLEAN |
|
Valid Range: |
TRUE/FALSE |
| |
TRUE= |
Makes text for 2D headers the same point size. |
| |
FALSE= |
Sizes text to give the appearance of perspective; the "further" the text recedes into the background, the smaller it gets. |
|
Default: |
FALSE |
|
Example: |
if ( bTextStyleIs2D )
{
SetGraphAttrSL( pGraph, pSelList,
A3D_AUTOFIT_TEXT, (void FAR *)&bAutofit );
SetGraphAttrSL( pGraph, pSelList,
A3D_FIXED_2D_TEXT,( void FAR *) &bSameSizeHdrs);
} else
{
SetGraphAttrSL ( pGraph, pSelList,
A3D_FONTBOX,(void FAR *) &bOutlineBox );
SetGraphAttrSL ( pGraph, pSelList,
A3D_TEXT_POSITION,(void FAR *) &bTextOnWall );
} |
|
Notes: |
This attribute also affects the object's associated _2D and _BOX objects (e.g., specifying O3D_COLTITLE as the ObjectID also affects the O3D_COLTITLE_2D and O3D_COLTITLE_BOX objects). |
|
Usage |
ObjectID |
SeriesID |
GroupID |
GraphTypes |
|
Requirements: |
Yes |
No |
No |
3D Riser, 3D Scatter |
| |
|
| |
This attribute enables/disables drawing of a solid-colored box behind a given instance of a 3D text object. Use SetGraphAttr() and specify the ObjectID of a text object to draw a box behind a particular text object. Use SetGraphAttrSI() to draw box behind the currently selected text object. Use SetGraphAttrSL() to apply this attribute to all text object (if any) in the selection list. |
|
Type: |
BOOLEAN16 |
|
Valid Range: |
TRUE/FALSE |
| |
TRUE= |
Draw box behind the text object |
| |
FALSE= |
Don't draw box |
|
Default: |
FALSE |
|
Example: |
if ( bTextStyleIs2D )
{
SetGraphAttrSL( pGraph, pSelList,
A3D_AUTOFIT_TEXT,(void FAR *)&bAutofit );
SetGraphAttrSL( pGraph, pSelList,
A3D_FIXED_2D_TEXT,(void FAR *)&bSameSizeHdrs);
} else
{
SetGraphAttrSL ( pGraph, pSelList,
A3D_FONTBOX, (void FAR *) &bOutlineBox );
SetGraphAttrSL ( pGraph, pSelList,
A3D_TEXT_POSITION,(void FAR *)&bTextOnWall );
} |
|
Notes: |
This attribute also affects the object's associated _2D and _BOX objects (e.g., specifying O3D_COLTITLE as the ObjectID also affects the O3D_COLTITLE_2D and O3D_COLTITLE_BOX objects). |
|
Also See: |
A3D_FONTMARGIN |
|
Usage |
ObjectID |
SeriesID |
GroupID |
GraphTypes |
|
Requirements: |
Yes |
No |
No |
3D Riser, 3D Scatter |
| |
|
| |
This attribute controls the size of the margin around a 3D-text object within its box (if a box has been enabled with A3D_FONTBOX). Use SetGraphAttr() and specify an ObjectID to select a particular text object. Use SetGraphAttrSI() to select the currently selected text object. Use SetGraphAttrSL() to apply this attribute to all text object (if any) in the selection list. |
|
Type: |
INT16 |
|
Valid Range: |
0...50%. Defines the percentage of the height of the 3D text box that will be allowed for a margin. |
| |
0= |
No margin: text inside the box extends to the edges of the box. |
| |
50= |
Margin between text and box edge = Box Height ÷ 2 (Htx50%). |
|
Default: |
10 |
|
Example: |
INT16 nMargin = 25;
SetGraphAttr ( gpGraph, GRAPH_LAYER,
O3D_COLTITLE, NULL_SERIESID,
NULL_GROUPID, A3D_FONTMARGIN,
(void FAR *) &nMargin); |
|
Notes: |
1. |
This attribute also affects the object's associated _2D and _BOX objects (e.g., specifying O3D_COLTITLE as the ObjectID also affects the O3D_COLTITLE_2D and O3D_COLTITLE_BOX objects). |
| |
2. |
For applications that use the OpenGL libraries only. |
|
Also See: |
A3D_FONT_BOX |
|
Usage |
ObjectID |
SeriesID |
GroupID |
GraphTypes |
|
Requirements: |
Yes |
No |
No |
3D Riser, 3D Scatter |
| |
|
| |
This attribute offsets a text header or title from its axis. Use SetGraphAttr() and specify an ObjectID to select a particular text object. Use SetGraphAttrSI() to select the currently selected text object. Use SetGraphAttrSL() to apply this attribute to all text object (if any) in the selection list. |
|
Type: |
INT16 |
|
Valid Range: |
0...200%. Percentage of total height of the text instance. |
| |
0%= |
Text would literally be attached to the given axis, with no space at all between the text and the axis line. |
| |
200%= |
Maximum allowable spacing: text is offset from the axis by a distance that equals twice (200%) the height of the text. |
|
Default: |
25 |
|
Notes: |
1. |
Although there is no real upper limit to the value that can be assigned to this attribute, anything larger than 200 makes the text too far away from the axis. For aesthetic reasons, the default value (25) is recommended. |
| |
2. |
This attribute also affects the object's associated _2D and _BOX objects (e.g., specifying O3D_COLTITLE as the ObjectID also affects the O3D_COLTITLE_2D and O3D_COLTITLE_BOX objects). |
| |
3. |
For applications that use the OpenGL libraries only. |
|
Also See: |
A3D_FONTBOX, A3D_FONTSIZE, A3D_FONTWIDTH |
|
Usage |
ObjectID |
SeriesID |
GroupID |
GraphTypes |
|
Requirements: |
Yes |
No |
No |
3D Riser, 3D Scatter |
| |
|
| |
This attribute sets the relative size of an instance of 3D text. It is expressed as a percentage of the total allowable text size for this instance. You can adjust the parameter down (i.e., make text smaller than the total allowable space), but you can't make it larger -- there is no way to force 3D text to write over its neighbor, for instance. |
| |
Consider this example: 4 series along the X (row) axis. 4 row headers, so each gets 25% of the total space. Thus, the maximum allowable setting is 25 -- but you could set it to 24, 23, 10, etc. However, if another data file is loaded with 10 series, then the attribute will be adjusted relative to the total amount of data -- what was 25 in the first example would be automatically adjusted to 10 after loading the new data. If you had changed the setting from 25 to say, 10 in the first example, the attribute will be reset to the maximum value - in this case, 10. This is done is to make sure that no matter how large or small a data set is loaded, the proportional space occupied by a given 3D-text instance is always the same. |
| |
Use SetGraphAttr() and specify an ObjectID to select a particular text object. Use SetGraphAttrSI() to select the currently selected text object. Use SetGraphAttrSL() to apply this attribute to all text object (if any) in the selection list. |
|
Type: |
INT16 |
|
Valid Range: |
Zero to the limit of the given text instance. If a value larger than the current allowable size percentage is used, the system will assume the maximum limit. |
|
Default: |
20 |
|
Notes: |
1. |
This attribute also affects the object's associated _2D and _BOX objects (e.g., specifying O3D_COLTITLE as the ObjectID also affects the O3D_COLTITLE_2D and O3D_COLTITLE_BOX objects). |
| |
2. |
For applications that use the OpenGL libraries only. |
|
Also See: |
A_FONTSIZE_VC, A3D_FONTWIDTH |
|
Usage |
ObjectID |
SeriesID |
GroupID |
GraphTypes |
|
Requirements: |
Yes |
No |
No |
3D Riser, 3D Scatter |
| |
|
| |
This attribute controls the width of a 3D-text object relative to its height. Use SetGraphAttr() and specify an ObjectID to specify the width of a particular text object. Use SetGraphAttrSI() to specify the width of the currently selected text object. Use SetGraphAttrSL() to apply this attribute to all text object (if any) in the selection list. |
|
Type: |
INT16 |
|
Valid Range: |
50...200 |
| |
50= |
Compressed to half the width of the normal font |
| |
100= |
Exactly the normal width of the font as Windows sees it |
| |
200= |
Twice the width of the normal font |
|
Default: |
100 |
|
Example: |
INT16 nFontWidth = 125;
SetGraphAttr ( gpGraph, GRAPH_LAYER,
O3D_COLTITLE, NULL_SERIESID,NULL_GROUPID,
A3D_FONTWIDTH, (void FAR *) &nFontWidth ); |
|
Notes: |
1. |
Technically, there is no upper or lower limit on this parameter, but anything smaller than 50 produces unreadable text, and anything larger than 200 produces distorted text. |
| |
2. |
This attribute also affects the object's associated _2D and _BOX objects (e.g., specifying O3D_COLTITLE as the ObjectID also affects the O3D_COLTITLE_2D and O3D_COLTITLE_BOX objects). |
| |
3. |
For applications that use the OpenGL libraries only. |
|
Also See: |
A3D_FONTSIZE |
|
Usage |
ObjectID |
SeriesID |
GroupID |
GraphTypes |
|
Requirements: |
Yes |
No |
No |
3D Riser, 3D Scatter |
| |
|
| |
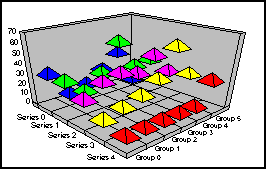
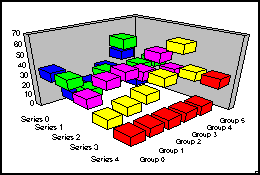
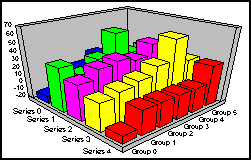
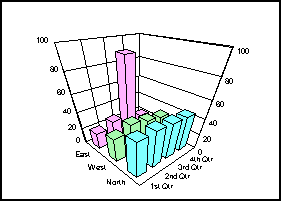
This attribute is a visualize feature that can be used to make 3D graphs more visible. The visualize attributes can be used to make any series, group, or individual riser glow (A3D_GLOW_RISER), suppressed (A3D_SUPPRESS_RISER), or transparent (A3D_TRANS_RISER). This attribute turns on a glow effect for a series, group, or individual riser. |
| |
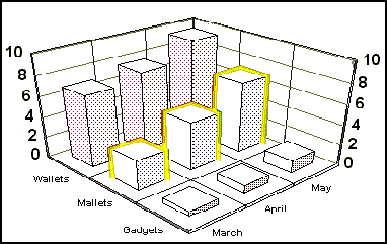
|
| |
The 2nd series of this chart (Mallets) has been set to Glow with a yellow RGB value. |
|
Type: |
typedef struct {
INT16 nVisualizeType;
INT16 nSeries;
INT16 nGroup;
INT16 nPercent;
BOOLEAN16 bPerformUndo;
INT16 nOperation;
RGB16 glowColor;
} TDG_VisualizeType, FAR * TDG_VisualizePtr; |
|
Valid Range: |
See the TDG_VisualizeType data structure in Appendix A. |
|
Default: |
None |
|
Example: |
The following example sets the 2nd series of a graph to Glow. This example is slightly modified from VDEMO.C: |
| |
// Init local copy of Visualize structure
TDG_VisualizeType VStruct;
//Set up struct for glowing second series
//4 is the glow code for future use
VStruct.nVisualizeType = 4;
VStruct.nSeries = 1;
/* 1 for the second series */
VStruct.nGroup = 0;
/* We don't care about the group */
VStruct.nPercent = 0;
/* Not used for Glow effect */
VStruct.bPerformUndo = FALSE;
/* Don't care about Undo now */
VStruct.nOperation = kSpecifiedSeries;
/* Glow the entire series */
VStruct.glowColor = aRGB[1];
/* Here's the color I want to use */
//Pass the structure to the attribute
SetGraphAttrSI (gpGraph,NULL,A3D_GLOW_RISER, &VStruct);
//Make the graph dirty
InvalidateRect (hWnd, &rOld, TRUE);
// And redraw showing the new settings
UpdateWindow(hWnd); |
|
Notes: |
1. |
For API use via the Set/GetGraphAttr calls, a copy of the structure RGB16 should be used (e.g., RGB16 myRGBstruct;). |
| |
2. |
The library does not modify the system color palette. If your application requires colors in addition to those in the system palette, your application must create and realize a logical palette into the system palette. |
| |
3. |
For Win32 use only. |
|
Also See: |
A3D_SUPPRESS_RISER, A3D_TRANS_RISER |
|
Usage |
ObjectID |
SeriesID |
GroupID |
GraphTypes |
|
Requirements: |
No |
Yes, specify in nSeries |
Yes, specify in nGroup |
3D Riser |
| |
This attribute determines whether an individual series or group of risers can have their own appearance. |
|
Type: |
INT16 |
|
Valid Range: |
A value from the GraphByMethods enum: |
| |
GraphByMethods |
Value |
Description |
| |
GraphByType |
0 |
All risers (series and group) in a 3D graph have the same shape |
| |
GraphBySeries |
1 |
Each series of risers can have their own individual appearance |
| |
GraphByGroup |
2 |
Each group of risers can have their own individual appearance |
|
Default: |
GraphByType |
|
Example: |
TDG_SeriesTypeSeriesType[]={
{ 0, G_3D_DiamondType } ,
{ 1, G_3D_OctagonType } };
INT16 nGraphBy = GraphBySeries;
SetGraphAttrSL(gpGraph,NULL,
A3D_GRAPH_BY_WHAT,(void FAR *) &nGraphBy);
/* Make Series 0 Risers a Diamond Shape */
SetGraphAttr(gpGraph, GRAPH_LAYER,
NULL_OBJECTID, 0,NULL_GROUPID, A3D_SERIES_TYPE,
(void FAR *) &SeriesType[0] );
/* Make Series 1 an Octagon Shape */
SetGraphAttr(gpGraph, GRAPH_LAYER,
NULL_OBJECTID, 1,NULL_GROUPID, A3D_SERIES_TYPE,
(void FAR *) &SeriesType[1] ); |
|
Notes: |
1. |
This attribute does not change the appearance of the risers in a series or a group. You must use A3D_SERIES_TYPE to specify a riser type after you have set this attribute to GraphBySeries or GraphByGroup. |
| |
2. |
If this attribute is set to GraphByType, all risers in the graph will assume the appearance of the sub-graph type set by A_GRAPH_PRESET. |
| |
3. |
You must use the DrawTheGraph() or DryRunTheGraph() function after this attribute is set in order for it to have any effect on the graph. |
|
Also See: |
A3D_SERIES_TYPE, A_GRAPH_PRESET |
|
Usage |
ObjectID |
SeriesID |
GroupID |
GraphTypes |
|
Requirements: |
No |
No |
No |
3D Riser |
| |
This attribute determines how far legend markers are set inside the legend margins. It works with A3D_INSET_LGND_TEXT to control the location of the two pieces of a legend box (marker and text) that can be used to create a variety of different legends, such as markers to the right of text, markers to the left of text, etc. For example, if the left margin is set to five, 5% of the box width is used as a left margin for the marker. If the right margin is set to 50, 50% of the box width is used as a right margin for the marker. The marker would be drawn in the left side of the box area allocated for the marker and text. |
|
Type: |
typedef struct {
INT xULC;
INT yULC;
INT xLRC;
INT yLRC;
} BoxInstRec; |
|
Valid Range: |
xULC/yULC: 0 to 100 Percentage of width used for left/top margin |
| |
xLRC/yLRC: 0 to 100 Percentage of width used for right/bottom margin |
|
Default: |
xULC = 5, xLRC = 60, yULC = 25, yLRC = 25 |
|
Notes: |
1. |
For API use via the Set/GetGraphAttr calls, a copy of the structure should be used. |
| |
2. |
Although BoxInstRec is normally used to define the upper left and lower right coordinates of a rectangle, in this case the structure is used to define margins within an area as a percentage of the areas width and height. |
| |
3. |
Realistically, the sum of left and right margins should never exceed 100 as that would mean 100 percent of width is set to margin and there is no space left to image the marker. The same applies to the top and bottom margins. |
| |
4. |
You should always leave space around the marker and text so there is an area to select the legend box on the chart. The marker is always centered in the defined box area. |
| |
5. |
The best way to define a larger font for a legend is to increase the amount of space available for the legend text. This is done using A3D_INSET_LGND_TEXT and A3D_INSET_LGND_ICON. |
|
Also See: |
A3D_INSET_LGND_TEXT |
|
Usage |
ObjectID |
SeriesID |
GroupID |
GraphTypes |
|
Requirements: |
No |
No |
No |
3D Scatter |
| |
This attribute controls how far legend text (boxes) are set inside the legend (top, left, bottom, and right margins). It works with A3D_INSET_LGND_ICON to control the location of the two pieces of a legend box, the marker and the text. These attributes can be used to create a variety of different legends, such as markers to the right of text, markers to the left of text, markers above text, markers below text, or even placing text directly on top of markers. These attributes are margin controls as a percentage of the space allocated for the marker and text within the legend box. For example, if the left margin is set to five, 5% of the box width is used as a left margin for the text. If the right margin to 50, 50% of the box width is used as a right margin for the text, the text would be drawn in the left side of the box allocated for the marker and text. |
|
Type: |
typedef struct {
INT xULC;
INT yULC;
INT xLRC;
INT yLRC;
} BoxInstRec; |
|
Valid Range: |
xULC/yULC: 0 to 100 Percentage of width used for left/top margin |
| |
xLRC/yLRC: 0 to 100 Percentage of width used for right/bottom margin |
|
Default: |
xULC = 42, yULC = 5, xLRC = 5, yLRC = 5 |
|
Notes: |
1. |
Although BoxInstRec is normally used to define the upper left and lower right coordinates of a rectangle, in this case the structure is used to define margins within an area as a percentage of the areas width and height. |
| |
2. |
Realistically, the sum of left and right margins should never exceed 100 as that would mean 100 percent of width is set to margin and there is no space left to display the text. Same applies to the top and bottom margins. |
| |
3. |
You should always leave space around the marker and text so there is an area to select the legend box on the chart. |
| |
4. |
Text is justified within the box as defined by A_FONTALIGN, normal default is left justified inside the defined box area. |
|
Also See: |
A_FONTALIGN, A3D_INSET_LGND_ICON |
|
Usage |
ObjectID |
SeriesID |
GroupID |
GraphTypes |
|
Requirements: |
No |
No |
No |
3D Scatter |
| |
This attribute defines the size and position of the bounding box for the legend within the overall graph (i.e., where it is positioned on the background). This attribute controls both the size and the position of the object. It is expressed in virtual coordinates. It affects the O5D_LEGENDS object. |
|
Type: |
typedef struct {
INT16 xULC, yULC;
INT16 xLRC, yLRC;
} BoxInstRec, FAR *BoxInstPtr; |
|
Valid Range: |
See the BoxInstRec structure in Appendix A. |
|
Default: |
xULC = -8025, yULX = -11395, zLRC = 10281, yLRC = -13480 |
|
Example: |
BoxInstRec NewLegLoc;
case IDM_AREA:
/* For Area Graph, move legend box to side of graph */
NewLegLoc.xULC = -15500;
NewLegLoc.yULC = 6500;
NewLegLoc.xLRC = -13500;
NewLegLoc.yLRC = -6500;
SetGraphAttr(gpGraph,GRAPH_LAYER,
NULL_OBJECTID,NULL_SERIESID, NULL_GROUPID,
A3D_LOCATE_LEGEND,(void FAR *)&NewLegLoc); |
|
Notes: |
The legend box should be large enough to accommodate the legend markers and text set by A3D_INSET_LGND_ICON and A3D_INSET_LGND_TEXT, respectively. |
|
Also See: |
A3D_INSET_LGND_ICON, A3D_INSET_LGND_TEXT, A3D_SHOW_LEGEND |
|
Usage |
ObjectID |
SeriesID |
GroupID |
GraphTypes |
|
Requirements: |
No |
No |
No |
3D Scatter |
| |
This attribute specifies the location and size of the 2D-text version of the left-vertical (Y1) axis title object in a 3D graph. The values assigned to the BoxInstRec specify the location and size of the object in virtual coordinates. |
|
Type: |
typedef struct {
INT16 xULC, yULC;
INT16 xLRC, yLRC;
} BoxInstRec, FAR *BoxInstPtr; |
|
Valid Range: |
See the BoxInstRec structure in Appendix A. |
|
Default: |
xULC = VirtualXMAX + 2000, yULX = 8000 |
| |
xLRC = VirtualXMIN + 6000, yLRC = 6000 |
|
Example: |
BoxInstRec NewLYTitleLoc;
NewLYTitleLoc.xULC = -15500;
NewLYTitleLoc.yULC = 6500;
NewLYTitleLoc.xLRC = -13500;
NewLYTitleLoc.yLRC = -6500;
SetGraphAttr(gpGraph,GRAPH_LAYER,
NULL_OBJECTID,NULL_SERIESID, NULL_GROUPID,
A3D_LOCATE_LYLTITLE_2D,(void FAR *) &NewLYTitleLoc); |
|
Also See: |
A3D_LOCATE_ROWTITLE_2D, A3D_LOCATE_RYTITLE_2D |
|
Usage |
ObjectID |
SeriesID |
GroupID |
GraphTypes |
|
Requirements: |
No |
No |
No |
3D Riser, 3D Scatter |
| |
|
| |
This attribute defines the location and size of the 2D-text version of the right Y-axis title in a 3D graph. The values assigned in the BoxInstRec specify the location and size of the object in virtual coordinates. |
|
Type: |
typedef struct {
INT16 xULC, yULC;
INT16 xLRC, yLRC;
} BoxInstRec, FAR *BoxInstPtr; |
|
Valid Range: |
See the BoxInstRec structure in Appendix A. |
|
Default: |
xULC = VirtualXMAX - 6000, yULX = 8000 |
| |
xLRC = VirtualXMAX - 2000, yLRC = 6000 |
|
Example: |
BoxInstRec NewRyTitleLoc;
NewRyTitleLoc.xULC = -15500;
NewRyTitleLoc.yULC = 6500;
NewRyTitleLoc.xLRC = -13500;
NewRyTitleLoc.yLRC = -6500;
SetGraphAttr(gpGraph,GRAPH_LAYER,
NULL_OBJECTID,NULL_SERIESID, NULL_GROUPID,
A3D_LOCATE_RYTITLE_2D,
(void FAR *) &NewRyTitleLoc); |
|
Also See: |
A3D_LOCATE_LYTITLE_2D, A3D_LOCATE_ROWTITLE_2D |
|
Usage |
ObjectID |
SeriesID |
GroupID |
GraphTypes |
|
Requirements: |
No |
No |
No |
3D Scatter |
| |
|
| |
This attribute defines the thickness of risers: X, Y, and Z. The "X" value (xThick) affects series. The "Y" value (yThick) controls height. The "Z" value (zThick) controls groups. In all graph types except 3D floating cubes, the height of a riser is defined by the data source and the yThick element in this data structure is not used. |
|
Type: |
typedef struct {
INT16 xThick
INT16 yThick
INT16 zThick
} TDG_RiserThick |
|
Valid Range: |
xThick: 0-200. 5 = Will produce needles, 100 = "Average" riser thickness, 200 = Would have all the risers touching each other. |
| |
yThick: Value Range = 0-200; |
| |
zThick: Value Range = 0-200; |
|
Default: |
xThick = 100, yThick = 100, zThick = 100 |
|
Notes: |
1. |
This attribute is not series dependent. It controls the thickness of all risers in a 3D graph. |
| |
2. |
You can set xThick and zThick to zero to make the risers auto-square. |
|
Also See: |
A3D_GLOW_RISER, A3D_SERIES_TYPE, A3D_UNIFORM_QDRSHAPES |
|
Usage |
ObjectID |
SeriesID |
GroupID |
GraphTypes |
|
Requirements: |
No |
No |
No |
3D Riser |
| |
|
| |
In applications where the data range can include negative numbers, this attribute defines the base from which risers are drawn. When this attribute is set to "1", risers will be drawn pointing up and down from a zero line. When this attribute is set to "0", risers will draw straight up from the base of the frame. This attribute affects axis labels, gridlines, and risers on all 3D graphs. |
|
Type: |
INT16 |
|
Valid Range: |
0/1 |
| |
0= |
Draw from the base of the frame |
| |
1= |
Draw from the zero line |
|
Default: |
0 (draw from the base of the frame) |
|
Example: |
SetGraphAttr(gpGraph,GRAPH_LAYER,NULL_OBJECTID,
NULL_SERIESID,NULL_GROUPID,
A3D_SCALEBASE, (void FAR *) &nZero); |
| |
|
| |
SetGraphAttr(gpGraph,GRAPH_LAYER,
NULL_OBJECTID,NULL_SERIESID,NULL_GROUPID,
A3D_SCALEBASE, (void FAR *) &nOne); |
| |
|
|
Also See: |
A3D_SCALEEND_X, A3D_SCALEEND_Y, A3D_SCALEEND_Z, A3D_SCALEFREQ_X, A3D_SCALEFREQ_Y, A3D_SCALEFREQ_Z, A3D_SCALERANGE_X, A3D_SCALERANGE_Y, A3D_SCALERANGE_Z |
|
Usage |
ObjectID |
SeriesID |
GroupID |
GraphTypes |
|
Requirements: |
No |
No |
No |
3D Riser, 3D Scatter |
| |
These attributes control drawing of minimum and maximum values on an axis in a 3D chart. You can show all values on the axis (the default), all values but the minimum value, all values but the maximum value, or all values but the minimum and maximum. |
|
Type: |
INT16 |
|
Valid Range: |
One of the following #defines: |
| |
#define |
Value |
Description |
| |
SCALEEND_BOTH |
0 |
Normal axis scale. Show all values including minimum and maximum |
| |
SCALEEND_MINONLY |
1 |
Show all scale values except the maximum. |
| |
SCALEEND_MAXONLY |
2 |
Show all scale values except the minimum. |
| |
SCALEEND_NONE |
3 |
Show all scale values except the minimum and maximum |
|
Default: |
0 (SALEEND_BOTH) |
|
Example: |
SetGraphAttr(gpGraph,GRAPH_LAYER,NULL_OBJECTID,
NULL_SERIESID,NULL_GROUPID,
A3D_SCALEEND_Y, (void FAR *) &nThree); |
| |
|
|
Also See: |
A3D_SCALEBASE, A3D_SCALEFREQ_..., A3D_SCALERANGE_..., A3D_SCALETYPE_... |
|
Usage |
ObjectID |
SeriesID |
GroupID |
GraphTypes |
|
Requirements: |
No |
No |
No |
A3D_SCALEEND_X: |
| |
|
|
|
3D Scatter |
| |
|
|
|
A3D_SCALEEND_Y: |
| |
|
|
|
3D Riser, 3D Scatter |
| |
|
|
|
A3D_SCALEEND_Y: |
| |
|
|
|
3D Scatter |
| |
|
| |
These attributes define the skip factor for ROW labels. They control the frequency at which numeric labels are displayed on an axis. When a value greater than one is assigned to the attribute, the first label is always drawn and every n-1 labels are not drawn. |
|
Type: |
INT16 |
|
Valid Range: |
Any positive integer, less than or equal to the total number of labels. |
| |
0= |
Draw every label (NO SKIP) |
| |
1= |
Draw every label (NO SKIP) |
| |
2= |
Skip every other label |
| |
3= |
Draw 1 label, skip 2 |
| |
4...n |
Draw 1 label, skip 3...Draw 1 label, skip n-1 |
|
Default: |
Zero |
|
Notes: |
1. |
This attribute affects the axis labels on all 3D graphs. |
| |
2. |
This attribute does not affect axis gridlines -- gridlines are drawn even if the associated label has been skipped by an A3D_SCALEFREQ_... attribute. |
| |
3. |
This attribute may be modified by the PlaceDefaultElements() API function. |
|
Also See: |
A3D_SCALEBASE, A3D_SCALEEND_..., A3D_SCALERANGE_..., A3D_SCALETYPE_... |
|
Usage |
ObjectID |
SeriesID |
GroupID |
GraphTypes |
|
Requirements: |
No |
No |
No |
A3D_SCALEFREQ_X: |
| |
|
|
|
3D Scatter |
| |
|
|
|
A3D_SCALEFREQ_Y: |
| |
|
|
|
3D Riser, 3D Scatter |
| |
|
|
|
A3D_SCALEFREQ_Y: |
| |
|
|
|
3D Scatter |
| |
|
|
|
|
| |
These attributes define how values labels are calculated and drawn on the axes in a 3D graph. The elements of the data structure define full automatic scaling, manual scaling of the minimum value, manual scaling of the maximum value, or manual scaling of the minimum and maximum value. When automatic scaling is selected, the charting engine calculates and draws value labels on the axis based on the range of data in the data source that defines the graph. When manual scaling is selected, the values defined in fManualScaleMax and/or fManualScaleMin will be used as the maximum and/or minimum values on the axis. |
|
Type: |
typedef struct {
INT16 nManualScale;
REAL fManualScaleMax;
REAL fManualScaleMin;
} TDG_ScaleValuesInfo, FAR * TDG_ScaleValuesPtr; |
|
Valid Range: |
See the TDG_ScaleValuesInfo structure in Appendix A. |
|
Default: |
nManualScale = 0 |
| |
fManualScaleMax = 10000.0 |
| |
fManualScaleMin = 0.0 |
|
Notes: |
If A3D_SHOW_OFFSCALE is enabled, it will affect this attribute. |
|
Also See: |
A3D_SCALEBASE, A3D_SCALEEND_..., A3D_SCALEFREQ_..., A3D_SCALETYPE_..., A3D_SHOWOFFSCALE_... |
|
Usage |
ObjectID |
SeriesID |
GroupID |
GraphTypes |
|
Requirements: |
No |
No |
No |
A3D_SCALERANGE_X: |
| |
|
|
|
3D Scatter |
| |
|
|
|
A3D_SCALERANGE_Y: |
| |
|
|
|
3D Riser, 3D Scatter |
| |
|
|
|
A3D_SCALERANGE_Y: |
| |
|
|
|
3D Scatter |
| |
|
|
|
|
| |
|
|
|
|
| |
When the A3D_GRAPH_BY_WHAT attribute is set to GraphBySeries or GraphByGroup, this attribute defines the shape of the risers in a series or a group. |
|
Type: |
typedef struct {
INT16 Series;
INT16 GraphType;
} TDG_SeriesType, FAR * TDG_SeriesTypePtr; |
|
Valid Range: |
See the TDG_SeriesType data structure in Appendix A. |
|
Default: |
Series = 0, GraphType = G_3D_BarType |
|
Example: |
TDG_SeriesTypeSeriesType[]={
{ 0, G_3D_DiamondType } ,
{ 1, G_3D_OctagonType } };
INT16 nGraphBy = GraphBySeries;
SetGraphAttrSL(gpGraph,NULL,
A3D_GRAPH_BY_WHAT,(void FAR *) &nGraphBy);
/* Make Series 0 Risers a Diamond Shape */
SetGraphAttr(gpGraph, GRAPH_LAYER,
NULL_OBJECTID, 0, NULL_GROUPID,
A3D_SERIES_TYPE,
(void FAR *) &SeriesType[0] );
/* Make Series 1 an Octagon Shape */
SetGraphAttr(gpGraph, GRAPH_LAYER,
NULL_OBJECTID, 1, NULL_GROUPID,
A3D_SERIES_TYPE, (void FAR *) &SeriesType[1] ); |
|
Notes: |
1. |
This attribute has no effect on the risers if the A3D_GRAPH_BY_WHAT attribute is set to GraphByType. When this is the case, all risers maintain the type defined by the sub-graph type in A_GRAPH_PRESET regardless of the A3D_SERIES_TYPE attribute. |
| |
2. |
If the targeted series exceeds both the number of series and groups currently being graphed, the charting engine will return a range error. |
|
Also See: |
A3D_GRAPH_BY_WHAT, A_GRAPH_PRESET |
|
Usage |
ObjectID |
SeriesID |
GroupID |
GraphTypes |
|
Requirements: |
No |
No |
No |
3D Riser |
| |
This attribute determine whether or not the column headers, column titles, data labels, left and right titles and numbers, row headers, and row titles will appear in a 3D graph. |
|
Type: |
BOOLEAN16 |
|
Valid Range: |
TRUE/FALSE |
| |
TRUE= |
Show all text |
| |
FALSE= |
Don't show any text |
|
Default: |
TRUE |
|
Example: |
/* Turn off all text in graph */
BOOLEAN bFALSE = FALSE;
SetGraphAttr(gpGraph, GRAPH_LAYER,
NULL_OBJECTID,NULL_SERIESID,NULL_GROUPID,
A3D_SHOWTEXT_ALL,
(void FAR *) &bFALSE); |
|
Notes: |
1. |
If this attribute is set FALSE to eliminate all text from the graph, you can use the individual A3D_SHOWTEXT_... attributes described below to make the individual text objects appear in the graph. |
| |
2. |
If A3D_SHOWTEXT_ALL is set TRUE to draw all text, you can use the individual attributes to select individual text items to appear in the graph. |
|
Also See: |
A3D_SHOWTEXT_COLHEADERS, A3D_SHOWTEXT_COLTITLE, A3D_SHOWTEXT_DATALABELS, A3D_SHOWTEXT_LEFTNUMBERS, A3D_SHOWTEXT_LEFTTITLE, A3D_SHOWTEXT_RIGHTNUMBERS, A3D_SHOWTEXT_RIGHTTITLE, A3D_SHOWTEXT_ROWHEADERS, A3D_SHOWTEXT_ROWTITLE |
|
Usage |
ObjectID |
SeriesID |
GroupID |
GraphTypes |
|
Requirements: |
No |
No |
No |
3D Riser, 3D Scatter |
| |
This attribute enables/disables drawing of the labels associated with a data text value in a 3D-scatter graph. |
|
Type: |
INT16 |
|
Valid Range: |
0/1 |
| |
0= |
Show labels |
| |
1= |
Don't show labels |
|
Default: |
0 (zero) |
|
Example: |
TDG_GraphPresetInfo GraphTable [4] = {
{TDG_GRAPH_BARS ,8},
{TDG_GRAPH_LINES,0},
{TDG_GRAPH_AREA ,4},
{TDG_GRAPH_3D, 16 /* Scatter */}};
nGraphType = 3;
int16 one = 1;
/* data format for X, Y, Z, Labels */
SetGraphAttrSL(gpGraph, NULL,
A3D_DATAFORMAT,
(void FAR *) &three);
/* Turn on the data text labels */
SetGraphAttrSL(gpGraph, NULL,
A3D_SHOWTEXT_DATALABELS,
(void FAR *) &one);
/* Select the 3D Scatter Graph Type */
SetGraphAttr(gpGraph, GRAPH_LAYER,
NULL_OBJECTID,NULL_SERIESID,NULL_GROUPID,
A_GRAPH_PRESET, (void FAR *)
&GraphTable[nGraphType]); |
|
Notes: |
The data format identified by A3D_DATAFORMAT must be set to "3" in order for this attribute to have any affect on the graph. It is not possible to draw data text values in a graph, this attribute shows the data text labels only. |
|
Also See: |
A3D_DATAFORMAT |
|
Usage |
ObjectID |
SeriesID |
GroupID |
GraphTypes |
|
Requirements: |
No |
No |
No |
3D Riser, 3D Scatter |
| |
|
| |
This attribute enables/disables drawing of the numbers on the left, vertical axis in a 3D graph (O3D_LYHEADER, O3D_LYHEADER_2D, and O3D_LYHEADER_BOX). |
|
Type: |
BOOLEAN16 |
|
Valid Range: |
TRUE/FALSE |
| |
TRUE= |
Show the numbers on the left, vertical axis |
| |
FALSE= |
Don't show the numbers |
|
Default: |
TRUE |
|
Example: |
/* Turn off left wall numbers */
BOOLEAN bFALSE = FALSE;
SetGraphAttr(gpGraph, GRAPH_LAYER,
NULL_OBJECTID, NULL_SERIESID,NULL_GROUPID,
A3D_SHOWTEXT_LEFTNUMBERS,
(void FAR *) &bFALSE); |
|
Notes: |
The A3D_SHOWTEXT_ALL attribute also affects whether or not numbers will appear on the left, vertical axis. If A3D_SHOWTEXT_ALL is set FALSE to eliminate all text from the graph, you can use A3D_SHOWTEXT_LEFTNUMBERS, to make the numbers appear. If A3D_SHOWTEXT_ALL is TRUE to draw all text, you can use A3D_SHOWTEXT_LEFTNUMBERS to eliminate only the numbers on the left, vertical axis of the graph. |
|
Also See: |
A3D_SHOWTEXT_ALL |
|
Usage |
ObjectID |
SeriesID |
GroupID |
GraphTypes |
|
Requirements: |
No |
No |
No |
3D Riser, 3D Scatter |
| |
|
| |
This attribute enables/disables drawing of the numbers on the left, vertical axis in a 3D graph (O3D_LYHEADER, O3D_LYHEADER_2D, and O3D_LYHEADER_BOX). |
|
Type: |
BOOLEAN |
|
Valid Range: |
TRUE/FALSE |
| |
TRUE= |
Show the numbers on the left, vertical axis |
| |
FALSE= |
Don't show the numbers |
|
Default: |
TRUE |
|
Example: |
/* Turn off left wall numbers */
BOOLEAN bFALSE = FALSE;
SetGraphAttr(gpGraph, GRAPH_LAYER,
NULL_OBJECTID,NULL_SERIESID,NULL_GROUPID,
A3D_SHOWTEXT_LEFTNUMBERS,
(void FAR *) &bFALSE); |
|
Notes: |
A3D_SHOWTEXT_ALL also affects whether or not numbers will appear on the left, vertical axis. If A3D_SHOWTEXT_ALL is FALSE to eliminate all text from the graph, you can use A3D_SHOWTEXT_LEFTNUMBERS, to make the numbers appear. If A3D_SHOWTEXT_ALL is TRUE to draw all text, you can use A3D_SHOWTEXT_LEFTNUMBERS to eliminate only the numbers on the left, vertical axis of the graph. |
|
Also See: |
A3D_SHOWTEXT_ALL |
|
Usage |
ObjectID |
SeriesID |
GroupID |
GraphTypes |
|
Requirements: |
No |
No |
No |
3D Riser, 3D Scatter |
| |
This attribute enables/disables drawing of the numbers on the right, vertical axis in a 3D graph. |
|
Type: |
BOOLEAN16 |
|
Valid Range: |
TRUE/FALSE |
| |
TRUE= |
Show the numbers on the right, vertical axis |
| |
FALSE= |
Don't show the numbers on the right, vertical axis |
|
Default: |
TRUE |
|
Example: |
/* Turn off right wall numbers */
BOOLEAN bFALSE = FALSE;
SetGraphAttr(gpGraph, GRAPH_LAYER,
NULL_OBJECTID,NULL_SERIESID,NULL_GROUPID,
A3D_SHOWTEXT_RIGHTNUMBERS,
(void FAR *) &bFALSE); |
|
Notes: |
1. |
A3D_SHOWTEXT_ALL also affects whether or not numbers will appear on the right, vertical axis. If A3D_SHOWTEXT_ALL is FALSE to eliminate all text from the graph, you can use A3D_SHOWTEXT_RIGHTNUMBERS, to make numbers appear. If A3D_SHOWTEXT_ALL is TRUE to draw all text, you can use A3D_SHOWTEXT_RIGHTNUMBERS to eliminate only the numbers on the right vertical axis of the graph. |
| |
2. |
This attribute also affects the O3D_RYHEADER_2D and O3D_RYHEADER_BOX objects. |
|
Also See: |
A3D_SHOWTEXT_ALL |
|
Usage |
ObjectID |
SeriesID |
GroupID |
GraphTypes |
|
Requirements: |
No |
No |
No |
3D Riser, 3D Scatter |
| |
|
| |
This attribute enables/disables drawing of the title associated with the right, vertical (Y2) axis in a 3D graph. |
|
Type: |
BOOLEAN16 |
|
Valid Range: |
TRUE/FALSE |
| |
TRUE= |
Show the title for the right, vertical axis |
| |
FALSE= |
Don't show the title for the right vertical axis |
|
Default: |
TRUE |
|
Example: |
/* Turn off right wall title */
BOOLEAN bFALSE = FALSE;
SetGraphAttr(gpGraph, GRAPH_LAYER,
NULL_OBJECTID,NULL_SERIESID,NULL_GROUPID,
A3D_SHOWTEXT_RIGHTTITLE,
(void FAR *) &bFALSE); |
|
Notes: |
1. |
A3D_SHOWTEXT_ALL also affects whether or not this title will appear in the graph. If A3D_SHOWTEXT_ALL is FALSE to eliminate all text from the graph, you can use A3D_SHOWTEXT_RIGHTTITLE, to make the title appear. If A3D_SHOWTEXT_ALL is TRUE to draw all text, you can use A3D_SHOWTEXT_RIGHTTITLE to eliminate only the title on the right vertical axis of the graph. |
| |
2. |
This attribute also affects the A3D_RYTITLE_2D and A3D_RYTITLE_BOX objects. |
|
Also See: |
A3D_SHOWTEXT_ALL |
|
Usage |
ObjectID |
SeriesID |
GroupID |
GraphTypes |
|
Requirements: |
No |
No |
No |
3D Riser, 3D Scatter |
| |
|
| |
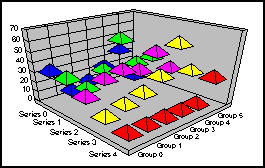
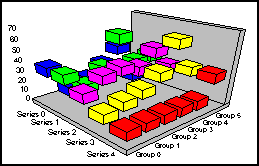
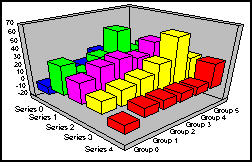
This attribute is a visualize feature that can be used to make 3D graphs more "visible". The Visualize attributes can be used to make any series, group, or individual riser glow (A3D_GLOW_RISER), suppressed (A3D_SUPPRESS_RISER), or transparent (A3D_TRANS_RISER). This attribute suppresses a series, group, or individual riser. Suppression means that the riser(s) in question are pushed down into the floor of the graph, so that they are not visible. |
| |
|
|
Type: |
typedef struct {
INT16 nVisualizeType;
INT16 nSeries;
INT16 nGroup;
INT16 nPercent;
BOOLEAN16 bPerformUndo;
INT16 nOperation;
RGB16 glowColor;
} TDG_VisualizeType, FAR * TDG_VisualizePtr; |
|
Valid Range: |
See the TDG_VisualizeType structure in Appendix A. |
|
Default: |
nVisualizeType: 2 |
| |
nSeries/nGroup: 1 |
| |
nPercent: NULL |
| |
nPerformUndo: FALSE |
| |
nOperation: kSpecifiedRiser(0) |
| |
glowColor: NULL |
|
Example: |
The following example suppresses the 2nd series of a graph: |
| |
// Init local copy of Visualize struct
TDG_VisualizeType VStruct;
VStruct.nVisualizeType = 2;
VStruct.nSeries = 1;
VStruct.nGroup = 0;
VStruct.nPercent = 0;
VStruct.bPerformUndo = FALSE;
/* Suppress entire series */
VStruct.nOperation=kSpecifiedSeries;
//Pass the structure to the attribute
SetGraphAttrSI (gpGraph,gpSelList,
A3D_SUPPRESS_RISER, &VStruct);
//Make the graph dirtyInvalidateRect (hWnd, &rOld, TRUE);
// And redraw showing the new settings
UpdateWindow(hWnd); |
| |
For an example of how to suppress everything BUT the selected series, substitute this code for the SetGraphAttrSI line in the above sample: |
| |
for (i=0; i < 4; i++)
{
VStruct.nSeries = i;
/* if not 2nd series, do suppression */
if (i != 1)SetGraphAttrSI (gpGraph, gpSelItem,
A3D_SUPPRESS_RISER,&VStruct);
} |
|
Also See: |
A3D_GLOW_RISER, A3D_RESCALE_ON_SUPPRESS, A3D_TRANS_RISER |
| |
|
|
Usage |
ObjectID |
SeriesID |
GroupID |
GraphTypes |
|
Requirements: |
No |
No |
No |
3D Riser |
| |
This attribute is used to specify the position of a text object in a 3D graph. It places 3D text on the wall/base (on the axis, i.e., on the edge of the floor, left or right wall) or "floating in space" next to the axis. |
|
Type: |
BOOLEAN |
|
Valid Range: |
TRUE/FALSE |
| |
TRUE= |
Draw the text on the wall/base itself |
| |
FALSE= |
Draw the text in space next to the wall/base. |
|
Default: |
FALSE |
|
Example: |
if ( bTextStyleIs2D ) {
SetGraphAttrSL( pGraph, pSelList,
A3D_AUTOFIT_TEXT, (void FAR *) &bAutofit );
SetGraphAttrSL( pGraph, pSelList,
A3D_FIXED_2D_TEXT,(void FAR *) &bSameSizeHdrs);
} else {
SetGraphAttrSL ( pGraph, pSelList,
A3D_FONTBOX, (void FAR *) &bOutlineBox );
SetGraphAttrSL ( pGraph, pSelList,
A3D_TEXT_POSITION,(void FAR *) &bTextOnWall );
} |
|
Notes: |
1. |
This attribute also affects the object's associated _2D and _BOX objects (e.g., specifying O3D_COLTITLE also affects the O3D_COLTITLE_2D and O3D_COLTITLE_BOX objects). |
| |
2. |
Use SetGraphAttr() and the object ID of a text object to position a specific text object. Use SetGraphAttrSI() to position the currently selected text object. Use SetGraphAttrSL to apply this attribute to all text objects in the selection list. |
|
Also See: |
A3D_TEXT_QUALITY |
|
Usage |
ObjectID |
SeriesID |
GroupID |
GraphTypes |
|
Requirements: |
No |
No |
No |
3D Riser, 3D Scatter |
| |
|
| |
This attribute selects an entry in the table of preset viewing angles for 3D graphs. It can be used as a shortcut for changing the viewing angle without invoking the custom viewing angles attribute. |
|
Type: |
INT16 |
|
Valid Range: |
0...15 |
| |
0= |
Standard: 30°/45° floor |
| |
1= |
Thick Standard: 30/30° floor, thicker walls than "0" |
| |
2= |
Low Thin: 60°/30° fl, walls smooshed down low & thin |
| |
|
|
| |
3= |
Near 1x3: 60°/30° fl., closer than "0", riser proportions=1 to 3 |
| |
4= |
Tall&Far: 30°/45° floor, expanded height., graph further away |
| |
5= |
Group View: 80°/10° floor, we face Group risers, thick RWall |
| |
6= |
NearGroup: 80°/10° floor, closer view of "5" |
| |
7= |
SeriesView:10°/80° fl, rotate "6": face Series risers |
| |
8= |
GroupStretch: z?-axis (group) stretch: riser proportions=1 to 6 |
| |
9= |
SeriesStretch: x?-axis (series) stretch: riser proportions=6 to 1 |
| |
10= |
Bird'sEye(LookDown): 45°/45° floor |
| |
|
|
| |
11= |
LowHigh: 30°/45° floor, walls compressed down, hi angle view |
| |
12= |
LowLow: like "11" but slightly lower angle of view |
| |
13= |
TallDistortion: extended ht.(y-axis), extreme perspective |
| |
14= |
FloorDistort: 30°/45° floor in "fish-eye" extreme perspective |
| |
|

|
| |
15= |
Isometric: 30°/30° floor, up close, iso.view =no perspective |
|
Default: |
Zero |
|
Notes: |
1. |
Preset viewing angles also contain 3D-font information, so that each angle has properly aligned 3D fonts. A3D_SHOWTEXT_ALL can be used to disable drawing of text when the graph viewing angle is changed. |
| |
2. |
A3D_CUSTOMVIEW, A3D_VIEWANGLES and A3D_VIEWSTRUCT can be used to create, save, and restore a graph look. Use A3D_VIEWANGLES to select a predefined angle/look. Use A3D_CUSTOMVIEW to modify the viewing angle. Use GetGraphAttr (...A3D_VIEWSTRUCT ...) to save the viewing angle created by A3D_VIEWANGLES and A3D_CUSTOMVIEW. Use SetGraphAttr (...A3D_VIEWSTRUCT...) to restore the saved view. |
|
Also See: |
A3D_CUSTOMVIEW, A3D_VIEWSTRUCT, the PGSDK Programmer's Manual for an illustration of each preset viewing angle. |
|
Usage |
ObjectID |
SeriesID |
GroupID |
GraphTypes |
|
Requirements: |
No |
No |
No |
3D Riser, 3D Scatter |
| |
This attribute redefines the entire 3D-viewing scene according to the values specified in TDG_ViewStruct. |
|
Type: |
typedef struct {
fMatrixType ViewMatrix;
dPoint3D ViewerPosition;
dPoint3D GraphSize;
dPoint3D WallThickness;
INT16 xPan;
INT16 yPan;
} TDG_ViewStruct |
|
Valid Range: |
See the TDG_ViewStruct data structure in Appendix A |
|
Default: |
None |
|
Example: |
static TDG_CustomView CV_Relative = {26,1};
static TDG_ViewStruct RestoredView;
if (wParam == IDM_ROTATE_RELATIVE)
{
SetGraphAttrSL (gpGraph,NULL,
A3D_CUSTOMVIEW, &CV_Relative);
}
if (wParam == IDM_RESTORE)
SetGraphAttr (gpGraph, GRAPH_LAYER,
NULL_OBJECTID, NULL_SERIESID, NULL_GROUPID,
A3D_VIEWSTRUCT,&RestoredView); |
|
Notes: |
1. |
Only use this attribute to save a custom view created by A3D_CUSTOMVIEW. Use GetGraphAttr() to save a custom view in the TDG_ViewStruct and SetGraphAttr() to restore the view. |
| |
2. |
A3D_CUSTOMVIEW, A3D_VIEWANGLES and A3D_VIEWSTRUCT can be used together to create, save, and restore a graph look. Use A3D_VIEWANGLES to select a predefined angle. Use A3D_CUSTOMVIEW to modify the viewing angle. Use GetGraphAttr (...A3D_VIEWSTRUCT ...) to save the viewing angle. Use SetGraphAttr (...A3D_VIEWSTRUCT...) to restore the saved view. |
|
Also See: |
A3D_VIEWANGLES, A3D_CUSTOMVIEW |
|
Usage |
ObjectID |
SeriesID |
GroupID |
GraphTypes |
|
Requirements: |
No |
No |
No |
3D Riser, 3D Scatter |