This method clears the labels in the chart look but not in the data that defines the chart.
SYNTAX:
INPUT:
None
RETURN:
void;
This method clears all data and labels from a chart.
SYNTAX:
INPUT:
None
RETURN:
void;
EXAMPLE:
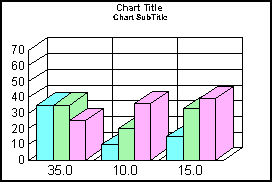
clearDataStorage();
setData(0, 0, 10);
setData(0, 1, 01);
setData(0, 2, 02);
setDataRangeToExtent();
This method clears all group labels.
SYNTAX:
INPUT:
None
RETURN:
void;
EXAMPLE:
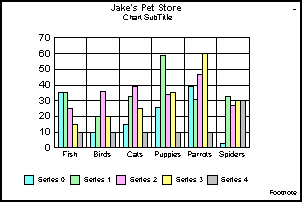
clearGroupLabels();
setViewableGroups(3);
setDataScrollerPresenceGroups(0);
setViewableSeries(3);
setDepthRadius(0);
ALSO SEE:
This method clears all series labels.
SYNTAX:
INPUT:
None
RETURN:
void;
EXAMPLE:
clearSeriesLabels();
setViewableGroups(3);
setDataScrollerPresenceGroups(0);
setViewableSeries(3);
setDepthRadius(0);
ALSO SEE:
This function clears all state entries in the zoom list. When zooming is enabled with doZoomIn() and doZoomOut(), the current state of zooming is maintained in a zoom list. For example, the initial, un-zoomed state is "state 0". When doZoomIn() is called (through the UI or the API), "state 1" specifies the zoomed-in state. When doZoomIn() is called again, "state 2" is appended to the list. The setZoomIndex() function can be used to change the state back to "state 1" (for example). If doZoomOut() is called, the old "state 2" is eliminated from the list (all states ABOVE the current one are eliminated), and the new zoomed-out state becomes state 2. This function will clear all entries in the zoom list and restore the list and the chart to its initial, un-zoomed state.
SYNTAX:
INPUT:
None
RETURN:
void;
ALSO SEE:
ZoomPercentage, doZoomIn(), doZoomOut(), getZoomIndex(), setZoomIndex()
This method zooms in on the data in a chart by the value of ZoomPercentage. ZoomDirection defines whether zooming is performed on the Y-axis, X-axis, or both.
- doZoomIn() zooms in on the center of the chart. This works without any selections or points and uses the current value of ZoomPercentage to determine how far the chart is zoomed. Change ZoomPercentage to use smaller zooming steps.
- doZoomIn(x, y) zooms in on a point in virtual coordinates. It is the same as doZoomIn() EXCEPT it zooms in on a point instead of the center of the graph. The point specification must be in virtual coordinates, NOT in screen pixels!
- doZoomIn(pt) zooms in on a point in virtual coordinates. It is the same as doZoomIn(x, y) except it uses the Java object POINT as rather than two integers. This format is useful when you want all of your code to use Objects rather than simple types. This type will not work from HTML, since HTML only allows simple types to be passed to Java.
- doZoomIn(r) zooms in on a rectangle in virtual coordinates. It is the same as the user interface "drag out a rectangle" mode (setSelectionEnable(5)). It allows you to pass in a valid Java Rectangle and have zooming use it as input. This format is useful if you plan to write your own "marquee" code or have some other mechanism where you want to pass a rectangle area to the chart.
SYNTAX:
INPUT:
x, y: X/Y coordinates of a point specified in virtual coordinates.
pt: A POINT Java object
r: A Java rectangle specified in Perspective virtual coordinates
RETURN:
void;
NOTES:
This method is not currently supported for 3D graph types.
ALSO SEE:
ZoomDirection, ZoomPercentage, get/setZoomIndex(), clearZoomList()
This method zooms out from the data in the chart by the value of ZoomPercentage. ZoomDirection defines whether zooming is performed on the Y-axis, X-axis, or both.
SYNTAX:
INPUT:
x, y: X/Y coordinates of a point specified in virtual coordinates.
pt: A POINT Java object
RETURN:
void;
NOTES:
ALSO SEE:
ZoomDirection, ZoomPercentage, doZoomIn(), get/setZoomIndex(), clearZoomList()
This method returns a boolean that identifies whether or not chart data is valid.
SYNTAX:
INPUT:
None
RETURN:
boolean; true/false; true = Chart data is valid, false = Data not valid
This method returns the numeric value for any row/column intersection.
SYNTAX:
INPUT:
row; Row from which to retrieve data
col; Column from which to retrieve data
RETURN:
double; the data at the specified row and column
ALSO SEE:
This method returns a value for any series/group intersection and converts it to a string.
SYNTAX:
INPUT:
row; row from which to get value
col; column from which to get value
RETURN:
string; string at row, col
EXAMPLE:
ALSO SEE:
This method can be used to determine the location of an object in a chart.
SYNTAX:
INPUT:
id; object ID returned by a getObject() method (e.g., getFrame())
item; data item
bCumulative; true/false
RETURN:
int; The x, y coordinates of an object in a chart
ALSO SEE:
This method returns the column starting position and number of columns and rows of data that are used to draw the chart.
SYNTAX:
INPUT:
None
RETURN:
Rectangle; data extents dimension type.
This method returns a data value for an object at a specified coordinates in a chart.
SYNTAX:
INPUT:
id; object ID returned by a getObject() method (e.g., getY1Axis())
nCoordVC; Virtual coordinance of object
item; data item
RETURN:
double; the data at the specified coordinates
ALSO SEE:
These methods get/set a label string for a specified series (s) and group (g).
SYNTAX:
INPUT:
s; Series number
g; Group number
newValue; Data label string
RETURN:
String; the data label at series (s)/group (g)
EXAMPLE:
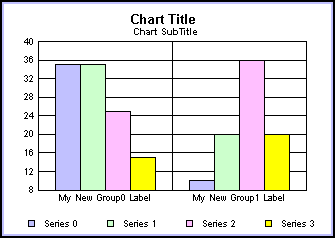
setDataLabel(0, 0, "My New Group 0 Label");
setDataLabel(0, 1, "My New Group 1 Label");
setGroupLabel(0, getDataLabel(0, 0));
setGroupLabel(1, getDataLabel(0, 1));
setDataRange(0, 0, 3, 1);
ALSO SEE:
get/setGroupLabel(), get/setSeriesLabel(), For HTML ONLY, see setSeriesLabelArray() and setGroupLabelArray() in the Perspective for Java Programmer's Manual.
The getDataRange() method returns a rectangle that represents the current range of data viewed/charted in a graph. The setDataRange() method is used to establish the range of data that will be used in a chart.
SYNTAX:
INPUT:
rowStop; last row number
colStop; last column number
rowStart; first row number (0 if not specified)
colStart; first column number (0 if not specified)
RETURN:
Rectangle.x, Rectangle.y; Starting Row, Column
Rectangle.width, Rectangle.height; Ending Row, Column
EXAMPLE:
ALSO SEE:
setData(), setDataFileURL(), setDataFromCallBack(), setDataFromDataGrid(), setDataFromResultSet(), setDataFromSQL(), setDataRangeToExtent()
These methods get/set a data value for a data object (riser) in a chart.
SYNTAX:
INPUT:
id; object ID returned by a getObject() method (e.g., getSeriesGroup())
newValue; data value to be assigned to the object
RETURN:
double; data value at id
EXAMPLE:
These methods get/set a data value for a data object (riser) in a chart.
SYNTAX:
INPUT:
id; object ID returned by a getObject() method (e.g., getGroup())
groupID; a group number
RETURN:
String; group label
EXAMPLE:
NOTES:
If an object ID or group number is not specified, newValue is assigned to the first item in the selection list (if applicable).
ALSO SEE:
These methods get/set a label string associated with a series in a chart.
SYNTAX:
INPUT:
seriesID; Any valid series number
id; object ID returned by a getObject() method (e.g., getSeries())
newValue: series label string
RETURN:
String; series label
EXAMPLE:
NOTES:
If a specific object is not identified with the input parameters id or seriesID, these methods get/set the associated value (if any) for the first item in the selection list.
ALSO SEE:
These methods get/set a text string for a specified text object.
SYNTAX:
INPUT:
id; object ID returned by a getObject() method (e.g., getTitle())
newValue; string to assign to a text object
RETURN:
string; string assigned to the text object
EXAMPLE:
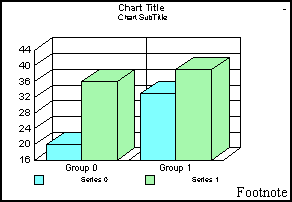
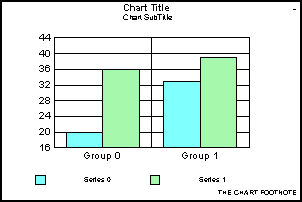
setDepthRadius(0);
setUseSampleData(false);
setData(0, 0, 20);
setData(0, 1, 36);
setData(1, 0, 33);
setData(1, 1, 39);
setDataRangeToExtent();
setTextString(getFootnote(),  "THE CHART FOOTNOTE");
NOTES:
If a specific object is not identified with the input parameter id, these methods get/set the associated value (if any) for the first item in the selection list.
ALSO SEE:
FootnoteString, O1TitleString, O2TitleString, SubtitleString, TitleString, X1TitleString, Y1TitleString, Y2TitleString
This method returns a rectangle that represents the current viewable range of data charted in a graph.
SYNTAX:
INPUT:
None
RETURN:
Rectangle.x; Starting Row
Rectangle.y; Starting Column
Rectangle.width; Ending Row
Rectangle.height; Ending Column
ALSO SEE:
This method returns a rectangle that represents the current viewable range of data charted in a graph in series in groups.
SYNTAX:
INPUT:
None
RETURN:
Rectangle.x; Starting Series
Rectangle.y; Starting Group
Rectangle.width; Ending Series
Rectangle.height; Ending Groups
ALSO SEE:
These methods get/set the current zoom state. When data zooming is enabled with the zoom properties/methods or via the user interface (setSelectionEnable(5)), Perspective will maintain a Zoom Index that keeps track of the number of times a chart has been zoomed in and the state of zooming. As an example, assume ZoomPercentage is set to 10%, and the user clicks ONCE. The chart is now zoomed to 90% of its original values, and the Zoom Index is now 1. Now the user clicks A SECOND TIME. The chart is now zoomed to 80% of its orignal values, and the zoom index now is 2. Or, actually, the zoom index now has TWO entries: one for the first, 90% state, and a second for the second, 80% state. You can keep adding to the zoom index as the user contines to click. Continuing with the example and the same values, assume the user has clicked eight consecutive times. The Zoom index now contains eight items:
- First Level: Zoom Factor 90%
- Second Level: Zoom Factor 80%
- Third Level: Zoom Factor 70%
- Fourth Level: Zoom Factor 60%
- Fifth Level: Zoom Factor 50%
- Sixth Level: Zoom Factor 40%
- Seventh Level: Zoom Factor 30%
- Eighth Level: Zoom Factor 20%
Your application can go back and forth in this list. For example, assume you want to switch from the "current" level (the last level the user clicked, the eighth zoom level which currently shows 20% of the original unzooomed state). You could use setZoomIndex(4) to IMMEDIATELY switch to the FOURTH level which had a zoom factor of 60%. You can use setZoomIndex() to switch back and forth between any zoom level set.
SYNTAX:
INPUT:
index; the new zoom index value
RETURN:
int: the index for the current zoom state (0=zooming is not enabled).
ALSO SEE:
isValidZoomIndex(), isZoomingArmed(), doZoomIn(), doZoomOut()
This method can be used to determine whether or not an SQL data type is numeric.
SYNTAX:
INPUT:
sqlType: an SQL data type
RETURN:
boolean; true = sqlType is one of: TINYINT, SMALLINT, INTEGER, FLOAT, REAL, DOUBLE, NUMERIC, DECIMAL, false = sqlType is not a numeric data type
ALSO SEE:
This method can be used to determine whether or not an SQL data type is a string.
SYNTAX:
INPUT:
sqlType: an SQL data type
RETURN:
boolean: true = sqlType is one of: CHAR, VARCHAR, or LONGVARCHAR, false = sqlType is not a string
ALSO SEE:
This method returns a boolean value indicating whether or not the zoom index identified by the input parameter, index, is valid. Use getZoomIndex() to get the current zoom index.
SYNTAX:
INPUT:
index: a zoom index number
RETURN:
boolean: true = index is valid, false = index is not valid
ALSO SEE:
This method returns a boolean value indicating whether or not data zooming has been enabled by a doZoomIn() or doZoomOut().
SYNTAX:
INPUT:
None
RETURN:
boolean; true = Zooming is enabled and graph has been zoomed in or out, false = Zooming is not enabled
ALSO SEE:
This method asks the chart to optimize the data. In general, this results in a no operation. But some charts can apply optimization methods.
SYNTAX:
INPUT:
None
RETURN:
boolean; true = Data is optimized, false = Data is not optimized.
ALSO SEE:
This method can be called when the "original data" should be reloaded into the chart.
SYNTAX:
INPUT:
None
RETURN:
void;
ALSO SEE:
This method sets the data value for a series/group intersection. This is THE master method for setting data in charts. You may also specify whether or not the chart should be repainted when the new value is assigned. You MUST use setDataRangeToExtent() or setDataRange() after the last setData() in order to include the data in the chart.
SYNTAX:
INPUT:
row; Row number
col; Column number
obj; Object ID
fValue; Data value to set at row/column
bRecalc; boolean - true = Recalculate/Repaint the chart when the new data value is assigned, false = Don't repaint the chart.
nMonth; For gantt and time scale axis charts, a month number (1...12)
nDay; For gantt and time scale axis charts, a day number (1...31)
nYear; For gantt and time scale axis charts, a 4-digit year number
RETURN:
void
EXAMPLE:
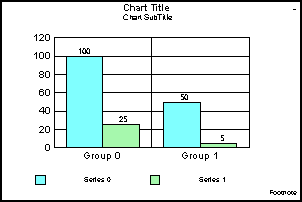
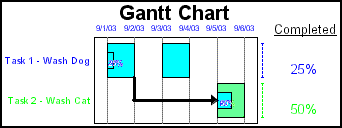
setGraphType(99);
setTitleString ("Gantt Chart");
setSubtitleDisplay(false);
setFootnoteDisplay(false);
setLegendDisplay(false);
setData(0, 0, 8, 1, 2003);
setData(0, 1, 8, 2, 2003);
setData(0, 2, 25.0);
setData(0, 3, 8, 3, 2003);
setData(0, 4, 8, 4, 2003);
setData(0, 5, 1);
setData(0, 6, -1);
setSeriesLabel(0, "Task 1 - Wash Dog");
setData(1, 0, 8, 5, 2003);
setData(1, 1, 8, 6, 2003);
setData(1, 2, 50.0);
setData(1, 3, 8, 7, 2003);
setData(1, 4, 8, 8, 2003);
setData(1, 5, 2);
setData(1, 6, -1);
setSeriesLabel(1, "Task 2 - Wash Cat");
setStartDate(8, 1, 2003);
setCurrentDate(8, 11, 2003);
setEndDate(8, 30, 2003);
setDataRange(0, 0, 1, 6);
ALSO SEE:
setDataFileURL(), setDataFromCallBack(), setDataFromDataGrid(), setDataFromResultSet(), setDataFromSQL(),
setDataRange(), setDataRangeToExtent(), "Data Requirements for Different Chart Types"
You can load any text file into Perspective. This can be done by using setDataFile() which takes any valid file location. The text file needs to be organized in "spreadsheet" fashion, with rows of number for series, and columns of numbers for groups. You can optionally supply row and/or column headers which will be used for labeling the series and groups. Each value must be in quotes and separated by a comma. If you ARE supplying row and column headers, the very first word in the file must be "labels", in quotes, separated by a comma.
SYNTAX:
INPUT:
inFilePath; any valid file location
RETURN:
void
EXAMPLE:
restoreDefaults();
setGraphType(41);
setDepthAngle(0);
setDepthRadius(0);
setUseSampleData(false);
setDataFile("A:/dataset1.txt");
The dataset1.txt file contains the following values:
NOTES:
This method will NOT work in a secure environment where files cannot just be accessed (like an applet in a browser's sandbox).
You can load any text file into a Perspective applet. This can be done by using setDataFileURL() which takes any valid file location or Internet URL as input or setDataStream() which takes a stream as input. The text file needs to be organized in "spreadsheet" fashion, with rows of number for series, and columns of numbers for groups. You can optionally supply row and/or column headers which will be used for labeling the series and groups. Each value must be in quotes and separated by a comma. If you ARE supplying row and column headers, the very first word in the file must be "labels", in quotes, separated by a comma.
SYNTAX:
INPUT:
aDataFileURL; any valid file location or Internet URL
RETURN:
void
ALSO SEE:
setData(), setDataFromCallBack(), setDataFromDataGrid(), setDataFromResultSet(), setDataFromSQL(), setDataStream()
TDGDataGrid is series of methods that must be implemented in an object. This method tells the charting engine to use TDGDataGrid to collect data for the chart.
SYNTAX:
INPUT:
grid; This parameter must identify an interface that represents an abstract data model that is one way of preparing data for graphing.
RETURN:
void
ALSO SEE:
setDataFromCallBack. See TDGDataGrid Methods for a description of the methods in the TDGDataGrid.
This method graphs columns and rows in the given result set. The result set is not closed.
SYNTAX:
INPUT:
rs; SQL Result Set
RETURN:
void
ALSO SEE:
This method graphs columns and rows in the given query. It creates a result set and closes the result set.
SYNTAX:
INPUT:
SQLQuery; A Java SQLQuery string
aStmt; An SQL statement
RETURN:
void
ALSO SEE:
This method sets the range of data to be used in the chart according to the number of values identified by the setData() method. It will override values that may be set by setDataRange().
SYNTAX:
INPUT:
None
RETURN:
void
ALSO SEE:
setData(), setDataFileURL(), setDataFromCallBack(), setDataFromDataGrid(), setDataFromResultSet(), setDataFromSQL(), setDataRange()
You can load any text file into a Perspective applet. This can be done by using setDataStream() which takes a stream as input or setDataFileURL() which takes any valid file location or Internet URL as input. The text file needs to be organized in "spreadsheet" fashion, with rows of number for series, and columns of numbers for groups. You can optionally supply row and/or column headers which will be used for labeling the series and groups. Each value must be in quotes and separated by a comma. If you ARE supplying row and column headers, the very first word in the file must be "labels", in quotes, separated by a comma.
SYNTAX:
INPUT:
in; Input Stream in which to load data.
RETURN:
void
ALSO SEE: